
![]()
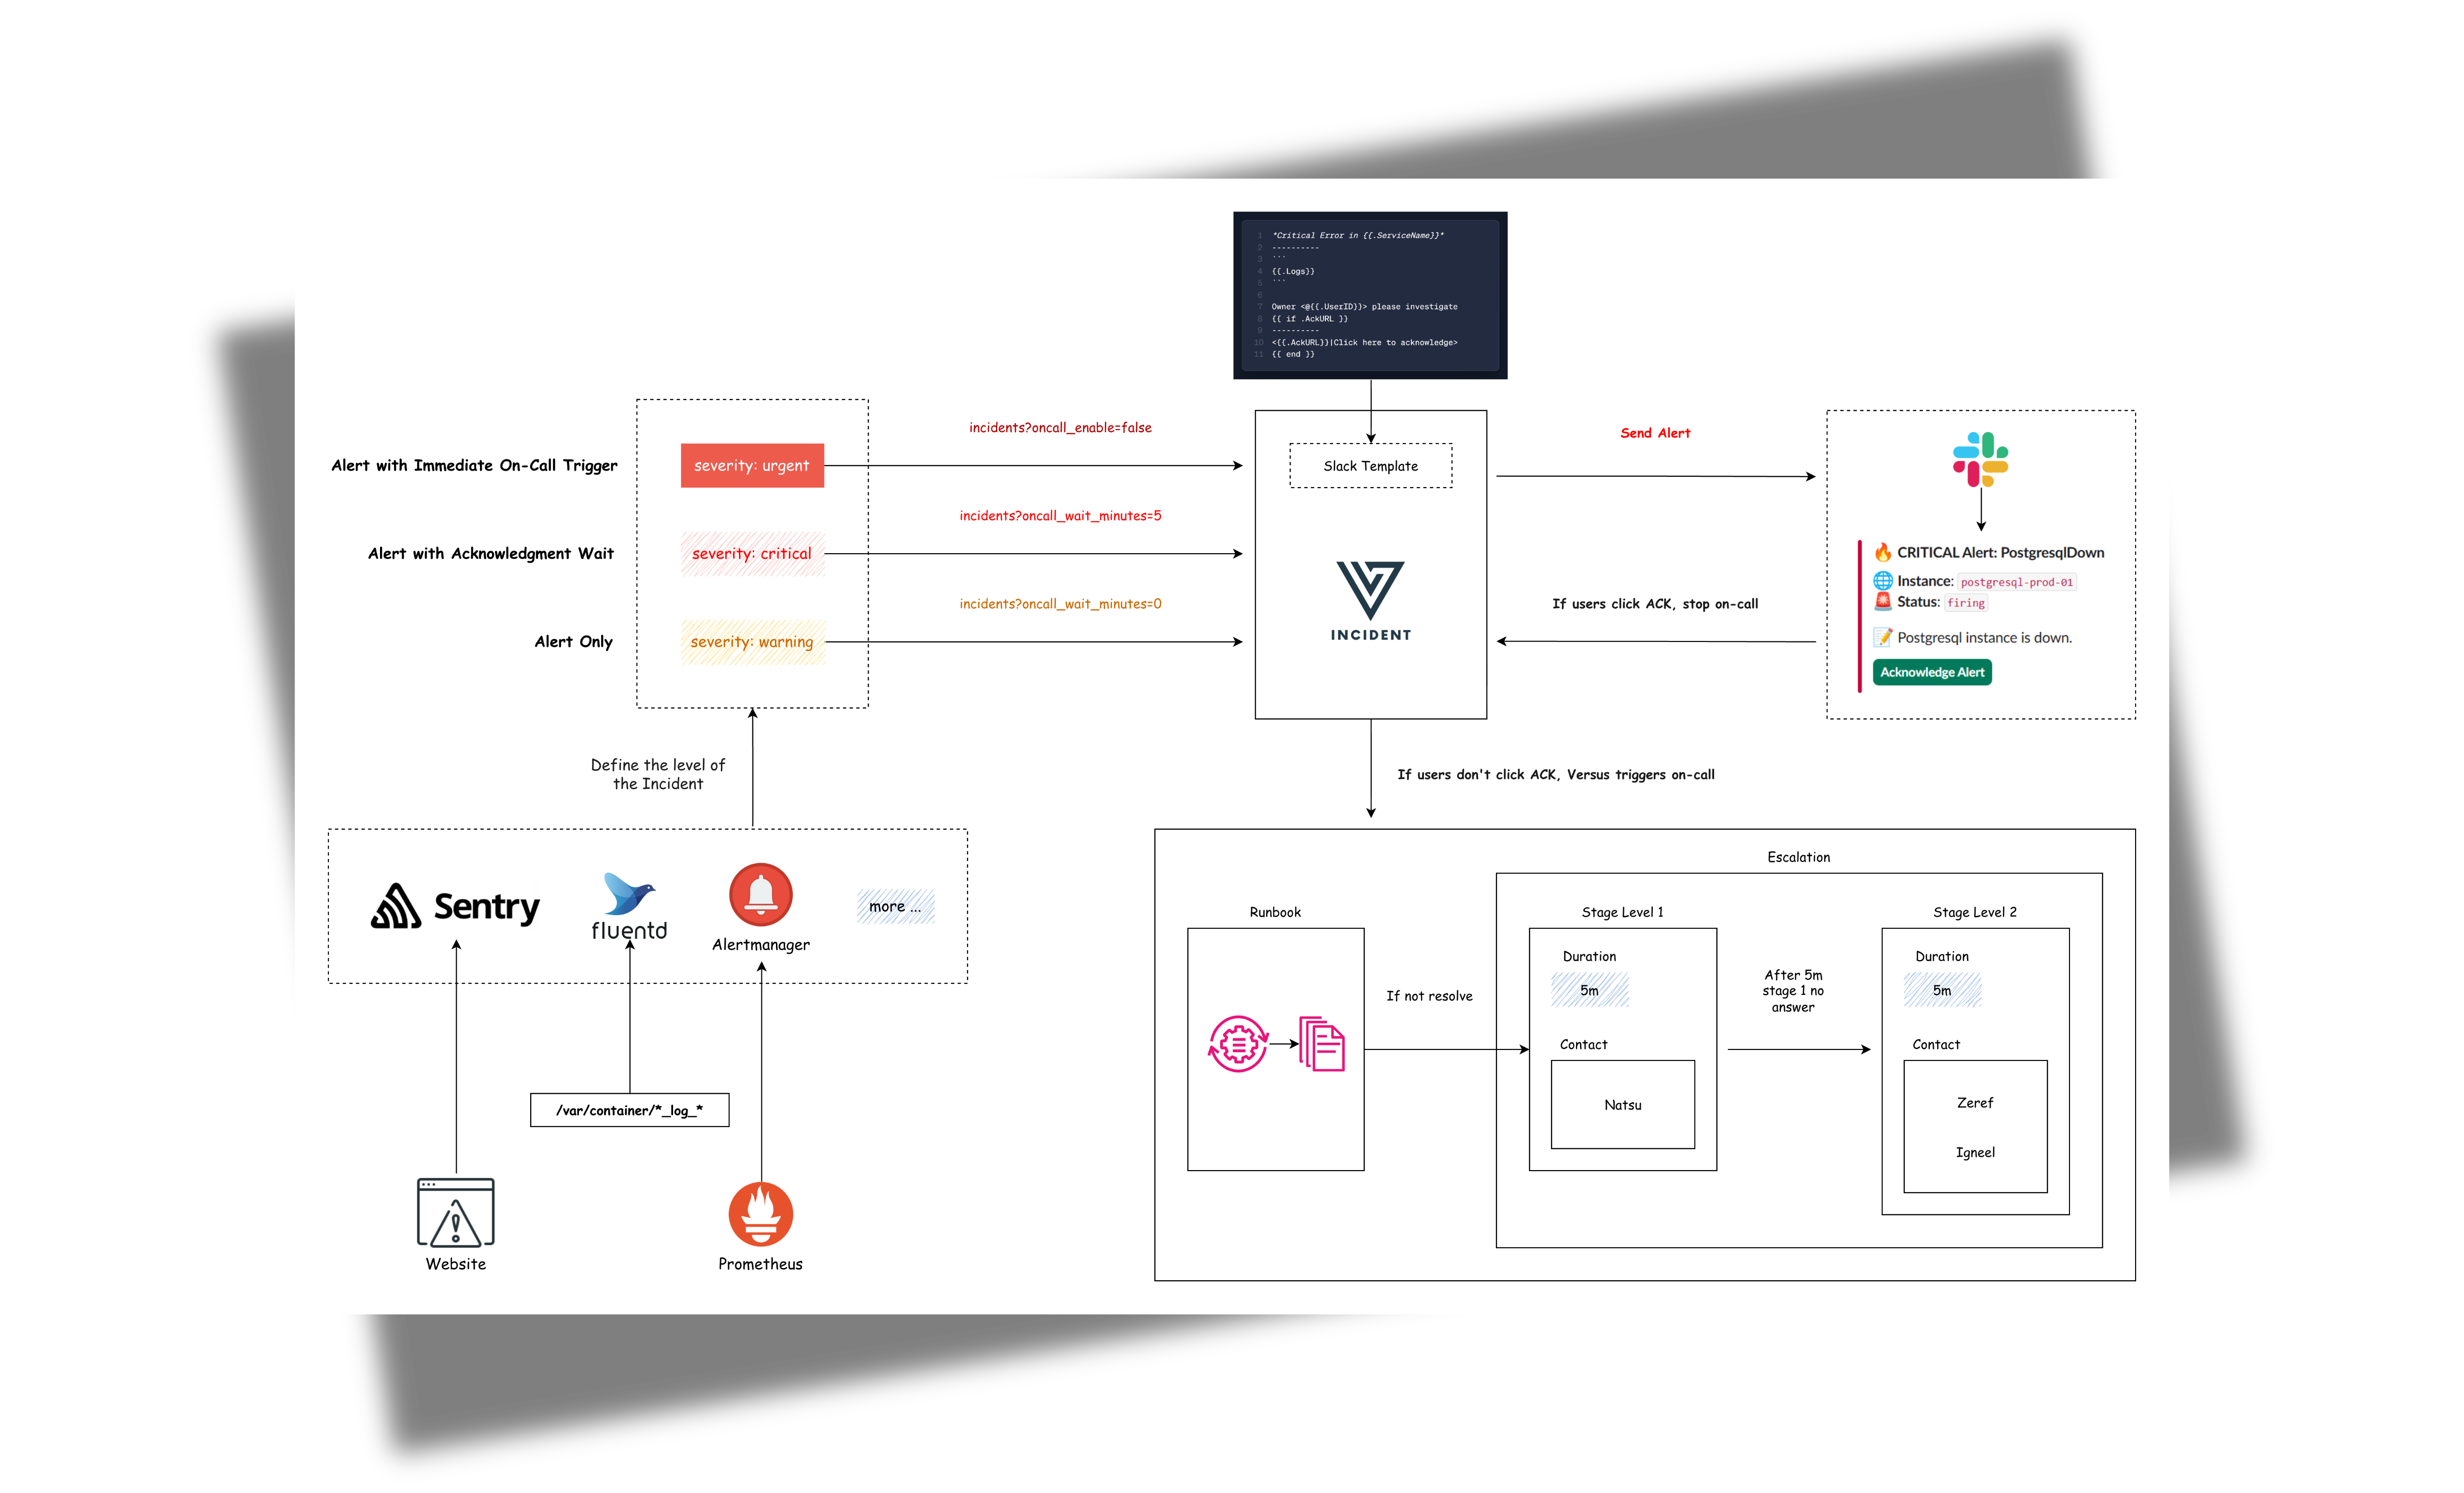
An incident management tool that supports alerting across multiple channels with easy custom messaging and on-call integrations. Compatible with any tool supporting webhook alerts, it's designed for modern DevOps teams to quickly respond to production incidents.
With the built-in AI SRE Agent, Versus goes further — continuously observing your logs, metrics, and traces, learning what normal looks like, and alerting you only when something new and unexpected appears.
Features
- 🚨 Multi-channel Alerts: Send incident notifications to Slack, Microsoft Teams, Telegram, and Email (more channels coming!)
- 📝 Custom Templates: Define your own alert messages using Go templates
- 🔧 Easy Configuration: YAML-based configuration with environment variables support
- 📡 REST API: Simple HTTP interface to receive alerts
- 📡 On-call: On-call integrations with AWS Incident Manager
- 🤖 AI Agent (Beta): An AI SRE agent that reads your logs, metrics and tracing, learns what normal looks like, and only alerts you when something new and unexpected appears.
Roadmap
See ROADMAP.md for the full list of shipped features, work in progress, and planned phases (more log sources, metrics, traces, cross-signal correlation).
Support The Project
GitHub Sponsors · see SPONSORS.md
Contributing
Contributions are welcome. Please read CONTRIBUTING.md for development setup, coding standards, and the PR process, and review the Code of Conduct and security policy before reporting vulnerabilities.
Project governance is documented in GOVERNANCE.md.
License
Distributed under the MIT License. See LICENSE for more information.
Getting Started
Table of Contents
- Prerequisites
- Easy Installation with Docker
- Admin Dashboard
- Storage Backend
- Universal Alert Template Support
- Development Custom Templates
- SNS Usage
- AI Agent
- On-Call
Prerequisites
- Docker 20.10+ (optional)
- Slack workspace (for Slack notifications)
- A
GATEWAY_SECRETvalue of your choosing (required if you want to use the admin dashboard)
Easy Installation with Docker
docker run -p 3000:3000 \
  -e GATEWAY_SECRET=change-me \
  -e SLACK_ENABLE=true \
  -e SLACK_TOKEN=your_token \
  -e SLACK_CHANNEL_ID=your_channel \
  ghcr.io/versuscontrol/versus-incident
Versus listens on port 3000 by default and exposes:
POST /api/incidents— webhook endpoint for monitoring tools.GET /— the embedded admin dashboard, open http://localhost:3000/ in your browser. For the full UI walkthrough and the build/watch scripts, see Admin Dashboard.
Universal Alert Template Support
Our default template automatically handles alerts from multiple sources, including:
- Alertmanager (Prometheus)
- Grafana Alerts
- Sentry
- CloudWatch SNS
- FluentBit
Example: Send an Alertmanager alert
curl -X POST "http://localhost:3000/api/incidents" \
  -H "Content-Type: application/json" \
  -d '{
    "receiver": "webhook-incident",
    "status": "firing",
    "alerts": [
      {
        "status": "firing",
        "labels": {
          "alertname": "PostgresqlDown",
          "instance": "postgresql-prod-01",
          "severity": "critical"
        },
        "annotations": {
          "summary": "Postgresql down (instance postgresql-prod-01)",
          "description": "Postgresql instance is down."
        },
        "startsAt": "2023-10-01T12:34:56.789Z",
        "endsAt": "2023-10-01T12:44:56.789Z",
        "generatorURL": ""
      }
    ],
    "groupLabels": {
      "alertname": "PostgresqlDown"
    },
    "commonLabels": {
      "alertname": "PostgresqlDown",
      "severity": "critical",
      "instance": "postgresql-prod-01"
    },
    "commonAnnotations": {
      "summary": "Postgresql down (instance postgresql-prod-01)",
      "description": "Postgresql instance is down."
    },
    "externalURL": ""
  }'
Example: Send a Sentry alert
curl -X POST "http://localhost:3000/api/incidents" \
  -H "Content-Type: application/json" \
  -d '{
    "action": "created",
    "data": {
      "issue": {
        "id": "123456",
        "title": "Example Issue",
        "culprit": "example_function in example_module",
        "shortId": "PROJECT-1",
        "project": {
          "id": "1",
          "name": "Example Project",
          "slug": "example-project"
        },
        "metadata": {
          "type": "ExampleError",
          "value": "This is an example error"
        },
        "status": "unresolved",
        "level": "error",
        "firstSeen": "2023-10-01T12:00:00Z",
        "lastSeen": "2023-10-01T12:05:00Z",
        "count": 5,
        "userCount": 3
      }
    },
    "installation": {
      "uuid": "installation-uuid"
    },
    "actor": {
      "type": "user",
      "id": "789",
      "name": "John Doe"
    }
  }'
Result:

Development Custom Templates
Docker
Create a configuration file:
mkdir -p ./config && touch config.yaml
config.yaml:
name: versus
host: 0.0.0.0
port: 3000

alert:
  slack:
    enable: true
    token: ${SLACK_TOKEN}
    channel_id: ${SLACK_CHANNEL_ID}
    template_path: "/app/config/slack_message.tmpl"

  telegram:
    enable: false

  viber:
    enable: false

  msteams:
    enable: false
Configuration Notes
Ensure template_path in config.yaml matches container path:
alert:
  slack:
    template_path: "/app/config/slack_message.tmpl" # For containerized env
Slack Template
Create your Slack message template, for example config/slack_message.tmpl:
🔥 *Critical Error in {{.ServiceName}}*

❌ Error Details:
```{{.Logs}}```

Owner <@{{.UserID}}> please investigate
Run with volume mount:
docker run -d \
  -p 3000:3000 \
  -v $(pwd)/config:/app/config \
  -e SLACK_ENABLE=true \
  -e SLACK_TOKEN=your_slack_token \
  -e SLACK_CHANNEL_ID=your_channel_id \
  --name versus \
  ghcr.io/versuscontrol/versus-incident
To test, simply send an incident to Versus:
curl -X POST http://localhost:3000/api/incidents \
  -H "Content-Type: application/json" \
  -d '{
    "Logs": "[ERROR] This is an error log from User Service that we can obtain using Fluent Bit.",
    "ServiceName": "order-service",
    "UserID": "SLACK_USER_ID"
  }'
Response:
{
    "status":"Incident created"
}
Result:

Understanding Custom Templates with Monitoring Webhooks
When integrating Versus with any monitoring tool that supports webhooks, you need to understand the JSON payload structure that the tool sends to create an effective template. Here's a step-by-step guide:
- Enable Debug Mode: First, enable debug_body in your config to see the exact payload structure:
alert:
  debug_body: true  # This will print the incoming payload to the console
-
Capture Sample Payload: Send a test alert to Versus, then review the JSON structure within the logs of your Versus instance.
-
Create Custom Template: Use the JSON structure to build a template that extracts the relevant information.
FluentBit Integration Example
Here's a sample FluentBit configuration to send logs to Versus:
[OUTPUT]
    Name            http
    Match           kube.production.user-service.*
    Host            versus-host
    Port            3000
    URI             /api/incidents
    Format          json
    Header          Content-Type application/json
    Retry_Limit     3
Sample FluentBit JSON Payload:
{
  "date": 1746354647.987654321,
  "log": "ERROR: Exception occurred while handling request ID: req-55ef8801\nTraceback (most recent call last):\n  File \"/app/server.py\", line 215, in handle_request\n    user_id = session['user_id']\nKeyError: 'user_id'\n",
  "stream": "stderr",
  "time": "2025-05-04T17:30:47.987654321Z",
  "kubernetes": {
    "pod_name": "user-service-6cc8d5f7b5-wxyz9",
    "namespace_name": "production",
    "pod_id": "f0e9d8c7-b6a5-f4e3-d2c1-b0a9f8e7d6c5",
    "labels": {
      "app": "user-service",
      "tier": "backend",
      "environment": "production"
    },
    "annotations": {
      "kubernetes.io/psp": "eks.restricted",
      "monitoring.alpha.example.com/scrape": "true"
    },
    "host": "ip-10-1-2-4.ap-southeast-1.compute.internal",
    "container_name": "auth-logic-container",
    "docker_id": "f5e4d3c2b1a0f5e4d3c2b1a0f5e4d3c2b1a0f5e4d3c2b1a0f5e4d3c2b1a0f5e4",
    "container_hash": "my-docker-hub/user-service@sha256:abcdef1234567890abcdef1234567890abcdef1234567890abcdef1234567890",
    "container_image": "my-docker-hub/user-service:v2.1.0"
  }
}
FluentBit Slack Template (config/slack_message.tmpl):
🚨 *Error in {{.kubernetes.labels.app}}* 🚨
*Environment:* {{.kubernetes.labels.environment}}
*Pod:* {{.kubernetes.pod_name}}
*Container:* {{.kubernetes.container_name}}

*Error Details:*
```{{.log}}```

*Time:* {{.time}}
*Host:* {{.kubernetes.host}}

<@SLACK_ONCALL_USER_ID> Please investigate!
Other Templates
Telegram Template
For Telegram, you can use HTML formatting. Create your Telegram message template, for example config/telegram_message.tmpl:
🚨 <b>Critical Error Detected!</b> 🚨
📌 <b>Service:</b> {{.ServiceName}}
⚠️ <b>Error Details:</b>
{{.Logs}}
This template will be parsed with HTML tags when sending the alert to Telegram.
Email Template
Create your email message template, for example config/email_message.tmpl:
Subject: Critical Error Alert - {{.ServiceName}}

Critical Error Detected in {{.ServiceName}}
----------------------------------------

Error Details:
{{.Logs}}

Please investigate this issue immediately.

Best regards,
Versus Incident Management System
This template supports both plain text and HTML formatting for email notifications.
Microsoft Teams Template
Create your Teams message template, for example config/msteams_message.tmpl:
**Critical Error in {{.ServiceName}}**

**Error Details:**

```{{.Logs}}```

Please investigate immediately
SNS Usage
docker run -d \
  -p 3000:3000 \
  -e SLACK_ENABLE=true \
  -e SLACK_TOKEN=your_slack_token \
  -e SLACK_CHANNEL_ID=your_channel_id \
  -e SNS_ENABLE=true \
  -e SNS_TOPIC_ARN=$SNS_TOPIC_ARN \
  -e SNS_HTTPS_ENDPOINT_SUBSCRIPTION=https://your-domain.com \
  -e AWS_ACCESS_KEY_ID=$AWS_ACCESS_KEY \
  -e AWS_SECRET_ACCESS_KEY=$AWS_SECRET_KEY \
  --name versus \
  ghcr.io/versuscontrol/versus-incident
Send test message using AWS CLI:
aws sns publish \
  --topic-arn $SNS_TOPIC_ARN \
  --message '{"ServiceName":"test-service","Logs":"[ERROR] Test error","UserID":"U12345"}' \
  --region $AWS_REGION
A key real-world application of Amazon SNS involves integrating it with CloudWatch Alarms. This allows CloudWatch to publish messages to an SNS topic when an alarm state changes (e.g., from OK to ALARM), which can then trigger notifications to Slack, Telegram, or Email via Versus Incident with a custom template.
Next steps
- Admin Dashboard — what the UI surfaces and how to rebuild the bundled assets.
- Configuration — every config key, env var, and per-request query parameter.
- Advanced Template Tips - learn how to write template
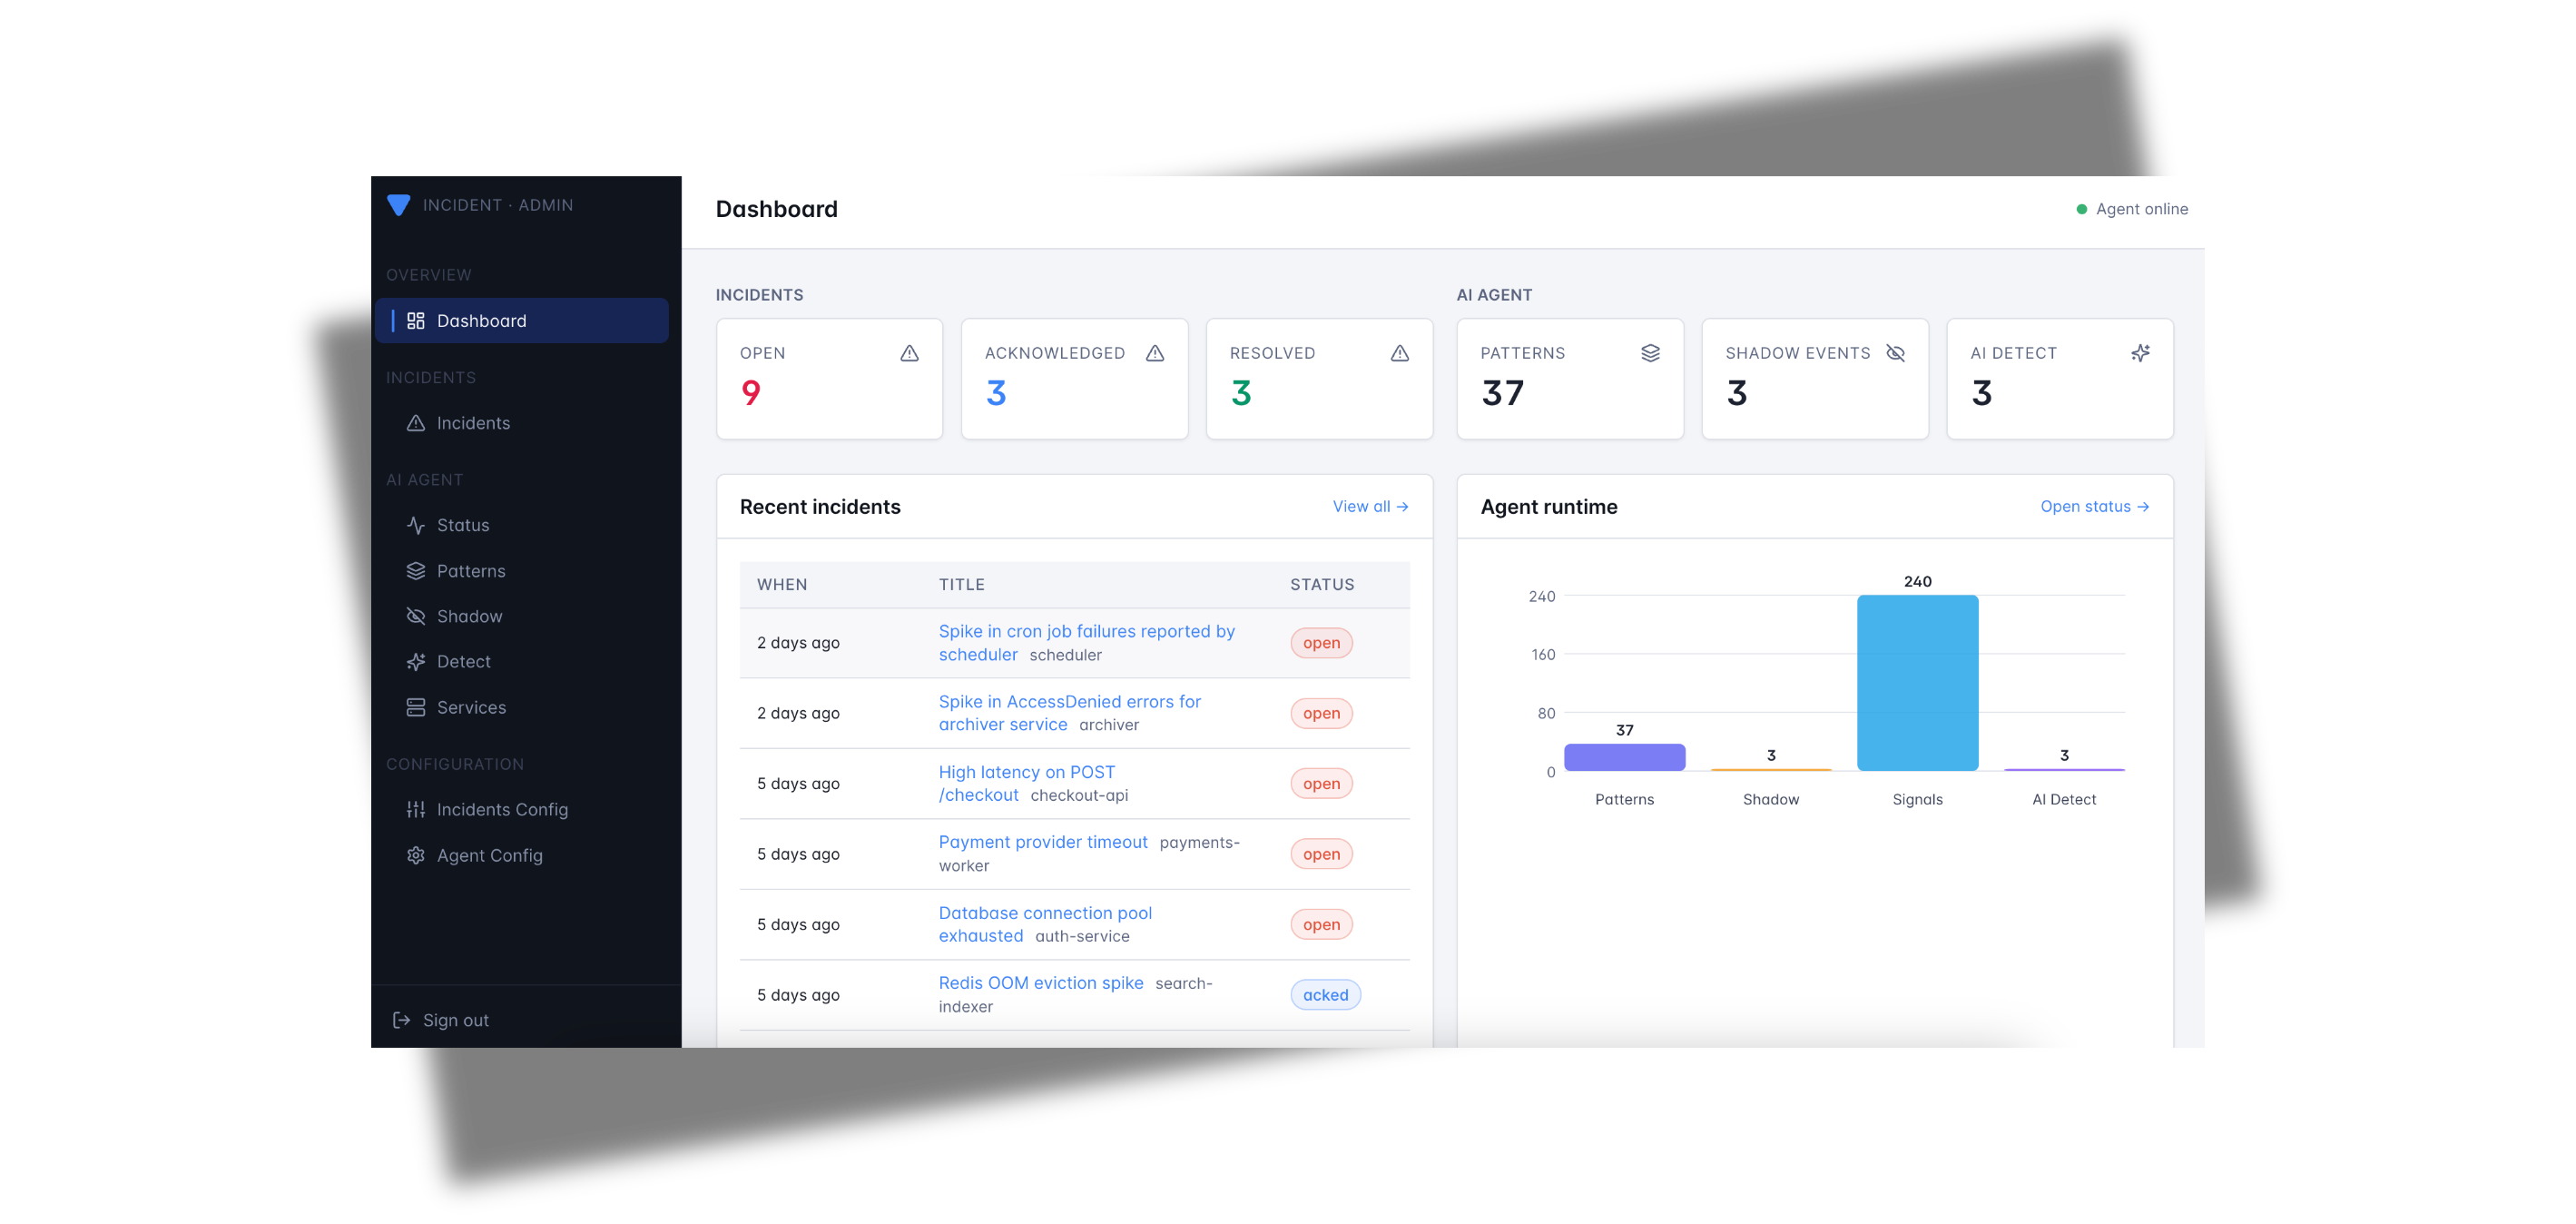
Admin Dashboard
Versus Incident ships with a built-in admin dashboard — a single-page React app embedded directly into the Go binary. There is no separate UI process to run; once the server is up, the dashboard is available at the root path.

Quick start
docker run -p 3000:3000 \
  -e GATEWAY_SECRET=change-me \
  -e SLACK_ENABLE=true \
  -e SLACK_TOKEN=$SLACK_TOKEN \
  -e SLACK_CHANNEL_ID=$SLACK_CHANNEL_ID \
  ghcr.io/versuscontrol/versus-incident
Then open http://localhost:3000/ in your browser.
Public URL. When running behind a reverse proxy or in Kubernetes, set
public_host(e.g.public_host: https://versus.example.com) inconfig.yamlso the startup banner and acknowledgement links use the externally-reachable address. Withpublic_hostempty, Versus falls back tohttp://<host>:<port>.
GATEWAY_SECRETis required for the dashboard to function. All admin endpoints (/api/admin/*and/api/agent/*) are gated by theX-Gateway-SecretHTTP header. The dashboard prompts you for this value the first time you load it and stores it in your browser'slocalStorage. With no secret configured the admin endpoints are not registered at all.
What you can do
The dashboard surfaces every persisted incident plus, when the AI agent is enabled, the full agent-runtime state. It is meant for day-to-day operations: triaging fresh alerts, acknowledging on-call pages, and curating the agent's pattern catalog.
Pages
| Page | Path | What it shows |
|---|---|---|
| Dashboard | /dashboard | At-a-glance metrics + Agent runtime bar chart, recent incidents, top patterns, recent shadow events. |
| Incidents | /incidents | Full incident history (newest first) with filters for open / acked / resolved and a free-text search. |
| Incident detail | /incidents/:id | Single incident: title, service, channels notified, on-call status, notify outcome, raw payload. |
| Agent status | /status | Worker mode, source count, catalog size, dirty flag. |
| Patterns | /patterns | Every pattern the miner has learned (count, verdict, service, rule, last seen). |
| Pattern detail | /patterns/:id | One pattern: full template, sample message, edit verdict / tags, delete. |
| Shadow | /shadow | NDJSON log of "would-have-alerted" events recorded in shadow mode. |
| Shadow detail | /shadow/:patternId | Drill into one shadow event with the matching catalog entry side-by-side. |
| Services | /services | Every service the agent has discovered, with first-seen timestamps and grace controls. |
Incident lifecycle
Every incident received via POST /api/incidents (or the SNS / SQS
listeners) is persisted to the configured storage backend immediately —
before the alert fan-out — so a downstream channel failure never
loses the record. Each incident carries:
notify_status—pending,sent, orfailed(withnotify_erroron failure). Visible as a coloured pill in the incidents table.acked_at— set when an operator clicks the acknowledge button in Slack/Telegram or hitsGET /api/ack/:incidentID. The dashboard reflects the new state on the next poll.resolved— true when the original payload'sstatus/state/alertStatefield equals"resolved". Resolved alerts skip on-call escalation and theAckURLinjection.
Agent management
When agent.enable: true, the dashboard exposes the agent's full admin
surface without you needing curl:
- Browse the pattern catalog and assign verdicts (
known,spike, custom) or tags so detect-mode emissions stay quiet for the things you've already triaged. - Inspect every shadow event — one click takes you from the recent feed to a detail page that shows the exact log line, the cluster template, and the catalog entry it would have matched.
- Force the worker to flush the catalog or shadow log to disk for
immediate persistence (the worker also flushes periodically — see
agent.catalog.persist_interval). - See services the agent has discovered; end or restart a service's grace period without restarting the binary.
Where the data lives
Everything the dashboard reads is durable. The default backend writes JSON to a directory on disk:
storage:
  type: file              # file | redis | database (env: STORAGE_TYPE)
  file:
    data_dir: ./data
    max_incidents: 1000   # rolling cap on persisted incidents
Files inside data_dir:
| File | Purpose |
|---|---|
incidents.json | All persisted incidents (most recent max_incidents). |
patterns.json | The agent's pattern catalog and the services map. |
shadow.json | Append-only NDJSON log of shadow events. |
Heads-up. Setting
storage.type: redisordatabaseis currently a config stub — the provider returnsstorage: backend not implemented. Stick withfile(the default) in production until these land.
Running without the UI
If you only need the API surface (for example, in a tightly-scoped CI
fixture), simply leave GATEWAY_SECRET unset. The admin endpoints stay
unregistered and the root path serves a small "UI not built" landing
page that links to /api/incidents and /healthz. The notification
fan-out is unaffected.
Template Syntax Guide
This document explains the template syntax (Go template syntax) used for create a custom alert template in Versus Incident.
Table of Contents
Basic Syntax
Access Data
Access data fields using double curly braces and dot notation, for example, with the data:
{
  "Logs": "[ERROR] This is an error log from User Service that we can obtain using Fluent Bit.",
  "ServiceName": "order-service",
}
Example template:
*Error in {{ .ServiceName }}*
{{ .Logs }}
Variables
You can declare variables within a template using the {{ $variable := value }} syntax. Once declared, variables can be used throughout the template, for example:
{{ $owner := "Team Alpha" }}
Owner: {{ $owner }}
Output:
Owner: Team Alpha
Pipelines
Pipelines allow you to chain together multiple actions or functions. The result of one action can be passed as input to another, for example:
upper: Converts a string to uppercase.
*{{ .ServiceName | upper }} Failure*
lower: Converts a string to lowercase.
*{{ .ServiceName | lower }} Failure*
title: Converts a string to title case (first letter of each word capitalized).
*{{ .ServiceName | title }} Failure*
default: Provides a default value if the input is empty.
*{{ .ServiceName | default "unknown-service" }} Failure*
slice: Extracts a sub-slice from a slice or string.
{{ .Logs | slice 0 50 }} // First 50 characters
replace: Replaces occurrences of a substring.
{{ .Logs | replace "error" "issue" }}
trimPrefix: Trims a prefix from a string.
{{ .Logs | trimPrefix "prod-" }}
trimSuffix: Trims a suffix from a string.
{{ .Logs | trimSuffix "-service" }}
len: Returns the length
{{ .Logs | len }} // Length of the message
urlquery: Escapes a string for use in a URL query.
uri /search?q={{ .Query | urlquery }}
split: splits a string into array using a separator.
{{ $parts := split "apple,banana,cherry" "," }}

{{/* Iterate over split results */}}
{{ range $parts }}
  {{ . }}
{{ end }}
You can chain multiple pipes together:
{{ .Logs | trim | lower | truncate 50 }}
Control Structures
Conditionals
The templates support conditional logic using if, else, and end keywords.
{{ if .IsCritical }}
🚨 CRITICAL ALERT 🚨
{{ else }}
⚠️ Warning Alert ⚠️
{{ end }}
and:
{{ and .Value1 .Value2 .Value3 }}
or:
{{ or .Value1 .Value2 "default" }}
Best Practices
Error Handling:
{{ If .Error }}
  {{ .Details }}
{{ else }}
  No error details
{{ end }}
Whitespace Control:
{{- if .Production }}  // Remove preceding whitespace
PROD ALERT{{ end -}}   // Remove trailing whitespace
Template Comments:
{{/* This is a hidden comment */}}
Negates a boolean value:
{{ if not .IsCritical }}
  This is not a critical issue.
{{ end }}
Checks if two values are equal:
{{ if eq .Status "critical" }}
  🚨 Critical Alert 🚨
{{ end }}
Checks if two values are not equal:
{{ if ne .Env "production" }}
  This is not a production environment.
{{ end }}
Returns the length of a string, slice, array, or map:
{{ if gt (len .Errors) 0 }}
  There are {{ len .Errors }} errors.
{{ end }}
Checks if a string has a specific prefix:
{{ if .ServiceName | hasPrefix "prod-" }}
  Production service!
{{ end }}
Checks if a string has a specific suffix:
{{ if .ServiceName | hasSuffix "-service" }}
  This is a service.
{{ end }}
Checks if a message contains a specific strings:
{{ if contains .Logs "error" }}
  The message contains error logs.
{{ else }}
  The message does NOT contain error.
{{ end }}
Loops
Iterate over slices/arrays with range:
{{ range .ErrorStack }}
- {{ . }}
{{ end }}
Microsoft Teams Templates
Microsoft Teams templates support Markdown syntax, which is automatically converted to Adaptive Cards when sent to Teams. As of April 2025 (with the retirement of Office 365 Connectors), all Microsoft Teams integrations use Power Automate Workflows.
Supported Markdown Features
Your template can include:
- Headings: Use
#,##, or###for different heading levels - Bold Text: Wrap text with double asterisks (
**bold**) - Code Blocks: Use triple backticks to create code blocks
- Lists: Create unordered lists with
-or*, and ordered lists with numbers - Links: Use
[text](url)to create clickable links
Automatic Summary and Text Fields
Versus Incident now automatically handles two important fields for Microsoft Teams notifications:
- Summary: The system extracts a summary from your template's first heading (or first line if no heading exists) which appears in Teams notifications.
- Text: A plain text version of your message is automatically generated as a fallback for clients that don't support Adaptive Cards.
You don't need to add these fields manually - the system handles this for you to ensure proper display in Microsoft Teams.
Example Template
Here's a complete example for Microsoft Teams:
# Incident Alert: {{.ServiceName}}

### Error Information
**Time**: {{.Timestamp}}
**Severity**: {{.Severity}}

## Error Details
```{{.Logs}}```

## Action Required
1. Check system status
2. Review logs in monitoring dashboard
3. Escalate to on-call if needed

[View Details](https://your-dashboard/incidents/{{.IncidentID}})
This will be converted to an Adaptive Card with proper formatting in Microsoft Teams, with headings, code blocks, formatted lists, and clickable links.
Configuration
Table of Contents
- Sample Configuration File
- Environment Variables
- Dynamic Configuration with Query Parameters
- SNS Listener
- AI Agent
- On-Call
A sample configuration file is located at config/config.yaml:
name: versus
host: 0.0.0.0
port: 3000
public_host: https://your-ack-host.example # Required for on-call ack & dashboard links

# Shared secret required for ALL admin endpoints (`/api/admin/*` and
# `/api/agent/*`) and the embedded admin dashboard. Sent by clients
# (and the dashboard) in the `X-Gateway-Secret` header. When empty,
# admin endpoints are not registered and the agent refuses to start.
gateway_secret: ${GATEWAY_SECRET}

# Storage backend used by BOTH the agent (catalog, shadow log, services)
# and the incident service (history shown in the UI). Only `file` is
# implemented today; `redis` and `database` are config stubs.
storage:
  type: file              # file | redis | database (env: STORAGE_TYPE)
  file:
    data_dir: ./data
    max_incidents: 1000   # rolling cap on persisted incidents

# Optional global proxy applied per-channel via `use_proxy: true` below
# (Telegram, Viber, Lark). Unset to disable.
proxy:
  url: ${PROXY_URL}           # HTTP/HTTPS/SOCKS5, e.g. http://proxy.example.com:8080
  username: ${PROXY_USERNAME}
  password: ${PROXY_PASSWORD}

alert:
  debug_body: true  # Default value, will be overridden by DEBUG_BODY env var

  slack:
    enable: false  # Default value, will be overridden by SLACK_ENABLE env var
    token: ${SLACK_TOKEN}            # From environment
    channel_id: ${SLACK_CHANNEL_ID}  # From environment
    template_path: "config/slack_message.tmpl"
    message_properties:
      button_text: "Acknowledge Alert" # Custom text for the acknowledgment button
      button_style: "primary" # Button style: "primary" (default blue), "danger" (red), or empty for default gray
      disable_button: false # Set to true to disable the button, if you want to handle acknowledgment differently

  telegram:
    enable: false  # Default value, will be overridden by TELEGRAM_ENABLE env var
    bot_token: ${TELEGRAM_BOT_TOKEN} # From environment
    chat_id: ${TELEGRAM_CHAT_ID} # From environment
    template_path: "config/telegram_message.tmpl"
    use_proxy: false # Set to true to use the global proxy block above

  viber:
    enable: false  # Default value, will be overridden by VIBER_ENABLE env var
    api_type: ${VIBER_API_TYPE} # From environment - "channel" (default) or "bot"
    bot_token: ${VIBER_BOT_TOKEN} # From environment (token for bot or channel)
    # Channel API (recommended for incident management)
    channel_id: ${VIBER_CHANNEL_ID} # From environment (required for channel API)
    # Bot API (for individual user notifications)
    user_id: ${VIBER_USER_ID} # From environment (required for bot API)
    template_path: "config/viber_message.tmpl"
    use_proxy: false

  email:
    enable: false # Default value, will be overridden by EMAIL_ENABLE env var
    smtp_host: ${SMTP_HOST} # From environment
    smtp_port: ${SMTP_PORT} # From environment
    username: ${SMTP_USERNAME} # From environment
    password: ${SMTP_PASSWORD} # From environment
    to: ${EMAIL_TO} # From environment
    subject: ${EMAIL_SUBJECT} # From environment
    template_path: "config/email_message.tmpl"

  msteams:
    enable: false # Default value, will be overridden by MSTEAMS_ENABLE env var
    power_automate_url: ${MSTEAMS_POWER_AUTOMATE_URL} # Power Automate HTTP trigger URL (required)
    template_path: "config/msteams_message.tmpl"
    other_power_urls: # Optional: Define additional Power Automate URLs for multiple MS Teams channels
      qc: ${MSTEAMS_OTHER_POWER_URL_QC} # Power Automate URL for QC team
      ops: ${MSTEAMS_OTHER_POWER_URL_OPS} # Power Automate URL for Ops team
      dev: ${MSTEAMS_OTHER_POWER_URL_DEV} # Power Automate URL for Dev team

  lark:
    enable: false # Default value, will be overridden by LARK_ENABLE env var
    webhook_url: ${LARK_WEBHOOK_URL} # Lark webhook URL (required)
    template_path: "config/lark_message.tmpl"
    use_proxy: false
    other_webhook_urls: # Optional: Enable overriding the default webhook URL using query parameters, eg /api/incidents?lark_other_webhook_url=dev
      dev: ${LARK_OTHER_WEBHOOK_URL_DEV}
      prod: ${LARK_OTHER_WEBHOOK_URL_PROD}

queue:
  enable: true
  debug_body: true

  # AWS SNS
  sns:
    enable: false
    https_endpoint_subscription_path: /sns # URI to receive SNS messages, e.g. ${host}:${port}/sns or ${https_endpoint_subscription}/sns
    # Options If you want to automatically create an sns subscription
    https_endpoint_subscription: ${SNS_HTTPS_ENDPOINT_SUBSCRIPTION} # If the user configures an HTTPS endpoint, then an SNS subscription will be automatically created, e.g. https://your-domain.com
    topic_arn: ${SNS_TOPIC_ARN}

  # AWS SQS
  sqs:
    enable: false
    queue_url: ${SQS_QUEUE_URL}

  # GCP Pub Sub (config stub — not yet implemented)
  pubsub:
    enable: false

  # Azure Service Bus (config stub — not yet implemented)
  azbus:
    enable: false

oncall:
  ### Enable overriding using query parameters
  # /api/incidents?oncall_enable=false => Set to `true` or `false` to enable or disable on-call for a specific alert
  # /api/incidents?oncall_wait_minutes=0 => Set the number of minutes to wait for acknowledgment before triggering on-call. Set to `0` to trigger immediately
  initialized_only: true  # Initialize on-call feature but don't enable by default; use query param oncall_enable=true to enable for specific requests
  enable: false # Use this to enable or disable on-call for all alerts
  wait_minutes: 3 # If you set it to 0, it means there's no need to check for an acknowledgment, and the on-call will trigger immediately
  provider: aws_incident_manager # Valid values: "aws_incident_manager" or "pagerduty"

  aws_incident_manager: # Used when provider is "aws_incident_manager"
    response_plan_arn: ${AWS_INCIDENT_MANAGER_RESPONSE_PLAN_ARN}
    other_response_plan_arns: # Optional: Enable overriding the default response plan ARN using query parameters, eg /api/incidents?awsim_other_response_plan=prod
      prod: ${AWS_INCIDENT_MANAGER_OTHER_RESPONSE_PLAN_ARN_PROD}
      dev: ${AWS_INCIDENT_MANAGER_OTHER_RESPONSE_PLAN_ARN_DEV}
      staging: ${AWS_INCIDENT_MANAGER_OTHER_RESPONSE_PLAN_ARN_STAGING}

  pagerduty: # Used when provider is "pagerduty"
    routing_key: ${PAGERDUTY_ROUTING_KEY} # Integration/Routing key for Events API v2 (REQUIRED)
    other_routing_keys: # Optional: Enable overriding the default routing key using query parameters, eg /api/incidents?pagerduty_other_routing_key=infra
      infra: ${PAGERDUTY_OTHER_ROUTING_KEY_INFRA}
      app: ${PAGERDUTY_OTHER_ROUTING_KEY_APP}
      db: ${PAGERDUTY_OTHER_ROUTING_KEY_DB}

redis: # Required for on-call functionality and the AI agent
  insecure_skip_verify: true # dev only
  host: ${REDIS_HOST}
  port: ${REDIS_PORT}
  password: ${REDIS_PASSWORD}
  db: 0

# -----------------------------------------------------------------------------
# AI agent (training | shadow | detect) — opt-in.
# When agent.enable=false (the default) nothing extra runs.
# Source list lives in a separate file (sources_path).
# -----------------------------------------------------------------------------
agent:
  enable: false              # master switch (env: AGENT_ENABLE)
  mode: training             # training | shadow | detect (env: AGENT_MODE)
  poll_interval: 30s         # how often each source is pulled
  lookback: 5m               # initial backfill window on startup
  batch_max: 5000            # safety cap per tick
  signal_max_bytes: 65536    # cap on Signal.Raw

  # Path to the YAML file listing log sources (resolved relative to this
  # config file). Override via env: AGENT_SOURCES_PATH.
  sources_path: ./agent_sources.yaml

  # Grace period for newly discovered services in shadow/detect mode.
  # During grace, signals are observed and clustered but never surfaced
  # as would-have-alerted (shadow) or sent to the AI analyzer (detect).
  # Set to "0" to disable.
  new_service_grace: 30m

  # Regexes used to extract a service name from each log message. The
  # first capture group of the first matching pattern wins. Empty list
  # disables service detection (everything attributed to "_unknown").
  service_patterns:
    - '(?i)\bservice[._-]?name["\s:=]+"?([A-Za-z0-9._-]+)'
    - '(?i)\b(?:service|svc|app|component)\s*=\s*"?([A-Za-z0-9._-]+)'
    - '(?i)"(?:service|svc|app|component)"\s*:\s*"([A-Za-z0-9._-]+)"'
    - '\[([A-Za-z0-9._-]+)\]'

  redaction:
    enable: true
    redact_ips: false        # IPs are usually useful context; opt-in
    extra_patterns:
      - "(?i)password=\\S+"
      - "Authorization:\\s*Bearer\\s+\\S+"

  catalog:
    persist_interval: 30s
    auto_promote_after: 50    # in detect mode, this many sightings = "known"
    # Spike detection: a known pattern is re-flagged when its tick-level
    # frequency exceeds the EWMA baseline by `spike_multiplier`.
    spike_multiplier: 5.0
    spike_min_frequency: 5
    spike_min_baseline_count: 20

  miner:
    similarity_threshold: 0.4
    tree_depth: 4
    max_children: 100

  regex:
    # Pre-filter: only signals matching at least one rule (named or
    # default) are forwarded to the miner. Set to ".*" to train on
    # every line, or leave empty to require an explicit named match.
    default_pattern: "(?i).*error.*"
    rules:
      - name: oom-killer
        pattern: "Out of memory: Killed process"
      - name: panic
        pattern: "(?i)panic:"
      - name: 5xx-burst
        pattern: "HTTP/[0-9.]+\\s+5\\d\\d"

  # AI analyzer — used in detect mode to assess unknown/spiking patterns.
  ai:
    enable: false                     # master switch (env: AGENT_AI_ENABLE)
    base_url: ${AGENT_AI_BASE_URL}    # OpenAI-compatible chat/completions endpoint
    api_key: ${AGENT_AI_API_KEY}
    model: "gpt-4o-mini"
    temperature: 0.2
    max_tokens: 512
    max_calls_per_hour: 60            # 0 = unlimited
    cache_ttl: "1h"
The runtime list of agent sources lives in the file referenced by
agent.sources_path (default ./agent_sources.yaml):
sources:
  - name: prod-app
    type: elasticsearch
    enable: true
    elasticsearch:
      addresses:
        - https://es.example.internal:9200
      username: ${ES_USERNAME}
      password: ${ES_PASSWORD}
      index: "logs-app-*"
      time_field: "@timestamp"
      query: 'log.level:(error OR warn)'
      message_field: message
      page_size: 500

  - name: sample-app
    type: file
    enable: true
    file:
      path: ./local/resource/sample-app.log
      format: text
      from_beginning: true
Environment Variables
The application relies on several environment variables to configure alerting services. Below is an explanation of each variable:
Common
| Variable | Description |
|---|---|
DEBUG_BODY | Set to true to enable print body send to Versus Incident. |
Admin & Gateway
| Variable | Description |
|---|---|
GATEWAY_SECRET | Shared secret required to access the admin dashboard and every /api/admin/* and /api/agent/* endpoint. Sent by clients in the X-Gateway-Secret header. When unset the admin endpoints are not registered at all. |
Storage
| Variable | Description |
|---|---|
STORAGE_TYPE | Storage backend for incidents and agent state. One of file (default and the only implemented backend today), redis, database. |
STORAGE_FILE_DATA_DIR | Directory for the file backend. Default ./data. Files written: incidents.json, patterns.json, shadow.json. |
Slack Configuration
| Variable | Description |
|---|---|
SLACK_ENABLE | Set to true to enable Slack notifications. |
SLACK_TOKEN | The authentication token for your Slack bot. |
SLACK_CHANNEL_ID | The ID of the Slack channel where alerts will be sent. Can be overridden per request using the slack_channel_id query parameter. |
Slack also supports interactive acknowledgment buttons that can be configured using the following properties in the config.yaml file:
alert:
  slack:
    # ...other slack configuration...
    message_properties:
      button_text: "Acknowledge Alert" # Custom text for the acknowledgment button
      button_style: "primary" # Button style: "primary" (default blue), "danger" (red), or empty for default gray
      disable_button: false # Set to true to disable the button, if you want to handle acknowledgment differently
These properties allow you to:
- Customize the text of the acknowledgment button (
button_text) - Change the style of the button (
button_style) - options are "primary" (blue), "danger" (red), or leave empty for default gray - Disable the interactive button entirely (
disable_button) if you want to handle acknowledgment through other means
Telegram Configuration
| Variable | Description |
|---|---|
TELEGRAM_ENABLE | Set to true to enable Telegram notifications. |
TELEGRAM_BOT_TOKEN | The authentication token for your Telegram bot. |
TELEGRAM_CHAT_ID | The chat ID where alerts will be sent. Can be overridden per request using the telegram_chat_id query parameter. |
Viber Configuration
Viber supports two types of API integrations:
- Channel API (default): Send messages to Viber channels for team notifications
- Bot API: Send messages to individual users for personal notifications
When to use Channel API:
- ✅ Broadcasting to team channels
- ✅ Public incident notifications
- ✅ Automated system alerts
- ✅ Better for most incident management scenarios
- ✅ No individual user setup required
When to use Bot API:
- ✅ Personal notifications to specific users
- ✅ Direct messaging for individual alerts
- ⚠️ Limited to individual users only
- ⚠️ Requires users to interact with bot first
- ⚠️ User IDs can be hard to obtain
| Variable | Description |
|---|---|
VIBER_ENABLE | Set to true to enable Viber notifications. |
VIBER_BOT_TOKEN | The authentication token for your Viber bot or channel. |
VIBER_API_TYPE | API type: "channel" (default) for team notifications or "bot" for individual messaging. |
VIBER_CHANNEL_ID | The channel ID where alerts will be posted (required for channel API). Can be overridden per request using the viber_channel_id query parameter. |
VIBER_USER_ID | The user ID where alerts will be sent (required for bot API). Can be overridden per request using the viber_user_id query parameter. |
Email Configuration
| Variable | Description |
|---|---|
EMAIL_ENABLE | Set to true to enable email notifications. |
SMTP_HOST | The SMTP server hostname (e.g., smtp.gmail.com). |
SMTP_PORT | The SMTP server port (e.g., 587 for TLS). |
SMTP_USERNAME | The username/email for SMTP authentication. |
SMTP_PASSWORD | The password or app-specific password for SMTP authentication. |
EMAIL_TO | The recipient email address(es) for incident notifications. Can be multiple addresses separated by commas. Can be overridden per request using the email_to query parameter. |
EMAIL_SUBJECT | The subject line for email notifications. Can be overridden per request using the email_subject query parameter. |
Microsoft Teams Configuration
The Microsoft Teams integration now supports both legacy Office 365 webhooks and modern Power Automate workflows with a single configuration option:
alert:
  msteams:
    enable: true
    power_automate_url: ${MSTEAMS_POWER_AUTOMATE_URL}
    template_path: "config/msteams_message.tmpl"
Automatic URL Detection (April 2025 Update)
As of the April 2025 update, Versus Incident automatically detects the type of URL provided in the power_automate_url setting:
-
Legacy Office 365 Webhook URLs: If the URL contains "webhook.office.com" (e.g.,
https://yourcompany.webhook.office.com/...), the system will use the legacy format with a simple "text" field containing your rendered Markdown. -
Power Automate Workflow URLs: For newer Power Automate HTTP trigger URLs, the system converts your Markdown template to an Adaptive Card with rich formatting features.
This automatic detection provides backward compatibility while supporting newer features, eliminating the need for separate configuration options.
| Variable | Description |
|---|---|
MSTEAMS_ENABLE | Set to true to enable Microsoft Teams notifications. |
MSTEAMS_POWER_AUTOMATE_URL | The Power Automate HTTP trigger URL for your Teams channel. Automatically works with both Power Automate workflow URLs and legacy Office 365 webhooks. |
MSTEAMS_OTHER_POWER_URL_QC | (Optional) Power Automate URL for the QC team channel. Can be selected per request using the msteams_other_power_url=qc query parameter. |
MSTEAMS_OTHER_POWER_URL_OPS | (Optional) Power Automate URL for the Ops team channel. Can be selected per request using the msteams_other_power_url=ops query parameter. |
MSTEAMS_OTHER_POWER_URL_DEV | (Optional) Power Automate URL for the Dev team channel. Can be selected per request using the msteams_other_power_url=dev query parameter. |
Lark Configuration
| Variable | Description |
|---|---|
LARK_ENABLE | Set to true to enable Lark notifications. |
LARK_WEBHOOK_URL | The webhook URL for your Lark channel. |
LARK_OTHER_WEBHOOK_URL_DEV | (Optional) Webhook URL for the development team. Can be selected per request using the lark_other_webhook_url=dev query parameter. |
LARK_OTHER_WEBHOOK_URL_PROD | (Optional) Webhook URL for the production team. Can be selected per request using the lark_other_webhook_url=prod query parameter. |
Queue Services Configuration
| Variable | Description |
|---|---|
SNS_ENABLE | Set to true to enable receive Alert Messages from SNS. |
SNS_HTTPS_ENDPOINT_SUBSCRIPTION | This specifies the HTTPS endpoint to which SNS sends messages. When an HTTPS endpoint is configured, an SNS subscription is automatically created. If no endpoint is configured, you must create the SNS subscription manually using the CLI or AWS Console. E.g. https://your-domain.com. |
SNS_TOPIC_ARN | AWS ARN of the SNS topic to subscribe to. |
SQS_ENABLE | Set to true to enable receive Alert Messages from AWS SQS. |
SQS_QUEUE_URL | URL of the AWS SQS queue to receive messages from. |
On-Call Configuration
| Variable | Description |
|---|---|
ONCALL_ENABLE | Set to true to enable on-call functionality for all incidents by default. Can be overridden per request using the oncall_enable query parameter. |
ONCALL_INITIALIZED_ONLY | Set to true to initialize on-call feature but keep it disabled by default. When set to true, on-call is triggered only for requests that explicitly include ?oncall_enable=true in the URL. |
ONCALL_WAIT_MINUTES | Time in minutes to wait for acknowledgment before escalating (default: 3). Can be overridden per request using the oncall_wait_minutes query parameter. |
ONCALL_PROVIDER | Specify the on-call provider to use ("aws_incident_manager" or "pagerduty"). |
AWS_INCIDENT_MANAGER_RESPONSE_PLAN_ARN | The ARN of the AWS Incident Manager response plan to use for on-call escalations. Required if on-call provider is "aws_incident_manager". |
AWS_INCIDENT_MANAGER_OTHER_RESPONSE_PLAN_ARN_PROD | (Optional) AWS Incident Manager response plan ARN for production environment. Can be selected per request using the awsim_other_response_plan=prod query parameter. |
AWS_INCIDENT_MANAGER_OTHER_RESPONSE_PLAN_ARN_DEV | (Optional) AWS Incident Manager response plan ARN for development environment. Can be selected per request using the awsim_other_response_plan=dev query parameter. |
AWS_INCIDENT_MANAGER_OTHER_RESPONSE_PLAN_ARN_STAGING | (Optional) AWS Incident Manager response plan ARN for staging environment. Can be selected per request using the awsim_other_response_plan=staging query parameter. |
PAGERDUTY_ROUTING_KEY | Integration/Routing key for PagerDuty Events API v2. Required if on-call provider is "pagerduty". |
PAGERDUTY_OTHER_ROUTING_KEY_INFRA | (Optional) PagerDuty routing key for feature team. Can be selected per request using the pagerduty_other_routing_key=infra query parameter. |
PAGERDUTY_OTHER_ROUTING_KEY_APP | (Optional) PagerDuty routing key for application team. Can be selected per request using the pagerduty_other_routing_key=app query parameter. |
PAGERDUTY_OTHER_ROUTING_KEY_DB | (Optional) PagerDuty routing key for database team. Can be selected per request using the pagerduty_other_routing_key=db query parameter. |
Enabling On-Call for Specific Incidents with initialized_only
When you have initialized_only: true in your configuration (rather than enable: true), on-call is only triggered for incidents that explicitly request it. This is useful when:
- You want the on-call feature ready but not active for all alerts
- You need to selectively enable on-call only for high-priority services or incidents
- You want to let your monitoring system decide which alerts should trigger on-call
Example configuration:
oncall:
  enable: false
  initialized_only: true  # feature ready but not active by default
  wait_minutes: 3
  provider: aws_incident_manager
  # ... provider configuration ...
With this configuration, on-call is only triggered when requested via query parameter:
# This alert will send notifications but NOT trigger on-call escalation
curl -X POST "http://localhost:3000/api/incidents" \
  -H "Content-Type: application/json" \
  -d '{
    "Logs": "[WARNING] Non-critical database latency increase.",
    "ServiceName": "database-monitoring",
    "UserID": "U12345"
  }'

# This alert WILL trigger on-call escalation because of the query parameter
curl -X POST "http://localhost:3000/api/incidents?oncall_enable=true" \
  -H "Content-Type: application/json" \
  -d '{
    "Logs": "[CRITICAL] Production database is down.",
    "ServiceName": "core-database",
    "UserID": "U12345"
  }'
Understanding On-Call Modes:
| Mode | Configuration | Behavior |
|---|---|---|
| Disabled | enable: falseinitialized_only: false | On-call feature is not initialized. No on-call functionality is available. |
| Always Enabled | enable: true | On-call is active for all incidents by default. Can be disabled per request with ?oncall_enable=false. |
| Opt-In Only | enable: falseinitialized_only: true | On-call feature is initialized but inactive by default. Must be explicitly enabled per request with ?oncall_enable=true. |
Redis Configuration
| Variable | Description |
|---|---|
REDIS_HOST | The hostname or IP address of the Redis server. Required if on-call is enabled. |
REDIS_PORT | The port number of the Redis server. Required if on-call is enabled. |
REDIS_PASSWORD | The password for authenticating with the Redis server. Required if on-call is enabled and Redis requires authentication. |
AI Agent Configuration
| Variable | Description |
|---|---|
AGENT_ENABLE | Set to true to start the AI agent worker. When false (default) no agent goroutines, files, or Redis keys are created. |
AGENT_MODE | Worker mode: training (observe and learn only), shadow (classify and log "would-have-alerted" events), or detect (classify + emit). |
AGENT_SOURCES_PATH | Path to the YAML file listing the agent's log sources. Resolved relative to the main config file. Default ./agent_sources.yaml. |
AGENT_NEW_SERVICE_GRACE | Duration a newly discovered service stays in implicit training before detect-mode AI analysis begins (e.g. 30m). 0 disables the grace window. |
AGENT_SERVICE_PATTERNS | Comma-separated list of regexes used to extract the service name from each log line. Each pattern must contain at least one capture group. Overrides the YAML list when set. |
AGENT_AI_ENABLE | Set to true to call the configured LLM in detect mode. When false, detect mode classifies but never calls the model (dry-run). |
AGENT_AI_BASE_URL | OpenAI-compatible chat/completions endpoint, e.g. https://api.openai.com/v1. |
AGENT_AI_API_KEY | Bearer token sent in the Authorization header when calling the LLM. |
AGENT_AI_MODEL | Model identifier, e.g. gpt-4o-mini. |
The agent also requires the root-level
GATEWAY_SECRET(see Admin & Gateway) and the root-levelredisblock — Redis is used to remember per-source cursors so the agent resumes from where it left off after a restart.
Ensure these environment variables are properly set before running the application.
Dynamic Configuration with Query Parameters
We provide a way to overwrite configuration values using query parameters, allowing you to send alerts to different channels and customize notification behavior on a per-request basis.
| Query Parameter | Description |
|---|---|
slack_channel_id | The ID of the Slack channel where alerts will be sent. Use: /api/incidents?slack_channel_id=<your_value>. |
telegram_chat_id | The chat ID where Telegram alerts will be sent. Use: /api/incidents?telegram_chat_id=<your_chat_id>. |
viber_channel_id | The channel ID where Viber alerts will be posted (for Channel API). Use: /api/incidents?viber_channel_id=<your_channel_id>. |
viber_user_id | The user ID where Viber alerts will be sent (for Bot API). Use: /api/incidents?viber_user_id=<your_user_id>. |
email_to | Overrides the default recipient email address for email notifications. Use: /api/incidents?email_to=<recipient_email>. |
email_subject | Overrides the default subject line for email notifications. Use: /api/incidents?email_subject=<custom_subject>. |
msteams_other_power_url | Overrides the default Microsoft Teams Power Automate flow by specifying an alternative key (e.g., qc, ops, dev). Use: /api/incidents?msteams_other_power_url=qc. |
lark_other_webhook_url | Overrides the default Lark webhook URL by specifying an alternative key (e.g., dev, prod). Use: /api/incidents?lark_other_webhook_url=dev. |
oncall_enable | Set to true or false to enable or disable on-call for a specific alert. Use: /api/incidents?oncall_enable=false. |
oncall_wait_minutes | Set the number of minutes to wait for acknowledgment before triggering on-call. Set to 0 to trigger immediately. Use: /api/incidents?oncall_wait_minutes=0. |
awsim_other_response_plan | Overrides the default AWS Incident Manager response plan ARN by specifying an alternative key (e.g., prod, dev, staging). Use: /api/incidents?awsim_other_response_plan=prod. |
pagerduty_other_routing_key | Overrides the default PagerDuty routing key by specifying an alternative key (e.g., infra, app, db). Use: /api/incidents?pagerduty_other_routing_key=infra. |
Examples for Each Query Parameter
Slack Channel Override
To send an alert to a specific Slack channel (e.g., a dedicated channel for database issues):
curl -X POST "http://localhost:3000/api/incidents?slack_channel_id=C01DB2ISSUES" \
  -H "Content-Type: application/json" \
  -d '{
    "Logs": "[ERROR] Database connection pool exhausted.",
    "ServiceName": "database-service",
    "UserID": "U12345"
  }'
Telegram Chat Override
To send an alert to a different Telegram chat (e.g., for network monitoring):
curl -X POST "http://localhost:3000/api/incidents?telegram_chat_id=-1001234567890" \
  -H "Content-Type: application/json" \
  -d '{
    "Logs": "[ERROR] Network latency exceeding thresholds.",
    "ServiceName": "network-monitor",
    "UserID": "U12345"
  }'
Viber Channel Override
To send an alert to a specific Viber channel (recommended for team notifications):
curl -X POST "http://localhost:3000/api/incidents?viber_channel_id=01234567890A=" \
  -H "Content-Type: application/json" \
  -d '{
    "Logs": "[ERROR] Mobile service experiencing high error rates.",
    "ServiceName": "mobile-api",
    "UserID": "U12345"
  }'
Viber User Override
To send an alert to a specific Viber user (for individual notifications):
curl -X POST "http://localhost:3000/api/incidents?viber_user_id=01234567890A=" \
  -H "Content-Type: application/json" \
  -d '{
    "Logs": "[ERROR] Personal alert for mobile service issue.",
    "ServiceName": "mobile-api",
    "UserID": "U12345"
  }'
Email Recipient Override
To send an email alert to a specific recipient with a custom subject:
curl -X POST "http://localhost:3000/api/incidents?email_to=network-team@yourdomain.com&email_subject=Urgent%20Network%20Issue" \
  -H "Content-Type: application/json" \
  -d '{
    "Logs": "[ERROR] Load balancer failing health checks.",
    "ServiceName": "load-balancer",
    "UserID": "U12345"
  }'
Microsoft Teams Channel Override
You can configure multiple Microsoft Teams channels using the other_power_urls setting:
alert:
  msteams:
    enable: true
    power_automate_url: ${MSTEAMS_POWER_AUTOMATE_URL}
    template_path: "config/msteams_message.tmpl"
    other_power_urls:
      qc: ${MSTEAMS_OTHER_POWER_URL_QC}
      ops: ${MSTEAMS_OTHER_POWER_URL_OPS}
      dev: ${MSTEAMS_OTHER_POWER_URL_DEV}
Then, to send an alert to the QC team's Microsoft Teams channel:
curl -X POST "http://localhost:3000/api/incidents?msteams_other_power_url=qc" \
  -H "Content-Type: application/json" \
  -d '{
    "Logs": "[ERROR] Quality check failed for latest deployment.",
    "ServiceName": "quality-service",
    "UserID": "U12345"
  }'
Lark Webhook Override
You can configure multiple Lark webhook URLs using the other_webhook_urls setting:
alert:
  lark:
    enable: true
    webhook_url: ${LARK_WEBHOOK_URL}
    template_path: "config/lark_message.tmpl"
    other_webhook_urls:
      dev: ${LARK_OTHER_WEBHOOK_URL_DEV}
      prod: ${LARK_OTHER_WEBHOOK_URL_PROD}
Then, to send an alert to the development team's Lark channel:
curl -X POST "http://localhost:3000/api/incidents?lark_other_webhook_url=dev" \
  -H "Content-Type: application/json" \
  -d '{
    "Logs": "[ERROR] Development server crash detected.",
    "ServiceName": "dev-server",
    "UserID": "U12345"
  }'
On-Call Controls
To disable on-call escalation for a non-critical alert:
curl -X POST "http://localhost:3000/api/incidents?oncall_enable=false" \
  -H "Content-Type: application/json" \
  -d '{
    "Logs": "[WARNING] This is a minor issue that doesn't require on-call response.",
    "ServiceName": "monitoring-service",
    "UserID": "U12345"
  }'
To trigger on-call immediately without the normal wait period for a critical issue:
curl -X POST "http://localhost:3000/api/incidents?oncall_wait_minutes=0" \
  -H "Content-Type: application/json" \
  -d '{
    "Logs": "[CRITICAL] Payment processing system down.",
    "ServiceName": "payment-service",
    "UserID": "U12345"
  }'
AWS Incident Manager Response Plan Override
You can configure multiple AWS Incident Manager response plans using the other_response_plan_arns setting:
oncall:
  enable: true
  wait_minutes: 3
  provider: aws_incident_manager

  aws_incident_manager:
    response_plan_arn: ${AWS_INCIDENT_MANAGER_RESPONSE_PLAN_ARN}  # Default response plan
    other_response_plan_arns:
      prod: ${AWS_INCIDENT_MANAGER_OTHER_RESPONSE_PLAN_ARN_PROD}  # Production environment
      dev: ${AWS_INCIDENT_MANAGER_OTHER_RESPONSE_PLAN_ARN_DEV}    # Development environment
      staging: ${AWS_INCIDENT_MANAGER_OTHER_RESPONSE_PLAN_ARN_STAGING}  # Staging environment
Then, to use a specific AWS Incident Manager response plan for a production environment issue:
curl -X POST "http://localhost:3000/api/incidents?awsim_other_response_plan=prod" \
  -H "Content-Type: application/json" \
  -d '{
    "Logs": "[CRITICAL] Production database cluster failure.",
    "ServiceName": "prod-database",
    "UserID": "U12345"
  }'
PagerDuty Routing Key Override
You can configure multiple PagerDuty routing keys using the other_routing_keys setting:
oncall:
  enable: true
  wait_minutes: 3
  provider: pagerduty

  pagerduty:
    routing_key: ${PAGERDUTY_ROUTING_KEY}  # Default routing key
    other_routing_keys:
      infra: ${PAGERDUTY_OTHER_ROUTING_KEY_INFRA}  # Infrastructure team
      app: ${PAGERDUTY_OTHER_ROUTING_KEY_APP}      # Application team
      db: ${PAGERDUTY_OTHER_ROUTING_KEY_DB}        # Database team
Then, to use a specific PagerDuty routing key for the infrastructure team:
curl -X POST "http://localhost:3000/api/incidents?pagerduty_other_routing_key=infra" \
  -H "Content-Type: application/json" \
  -d '{
    "Logs": "[ERROR] Server load balancer failure in us-west-2.",
    "ServiceName": "infrastructure",
    "UserID": "U12345"
  }'
Combining Multiple Parameters
You can combine multiple query parameters to customize exactly how an incident is handled:
curl -X POST "http://localhost:3000/api/incidents?slack_channel_id=C01PROD&telegram_chat_id=-987654321&oncall_enable=true&oncall_wait_minutes=1" \
  -H "Content-Type: application/json" \
  -d '{
    "Logs": "[CRITICAL] Multiple service failures detected in production environment.",
    "ServiceName": "core-infrastructure",
    "UserID": "U12345",
    "Severity": "CRITICAL"
  }'
This will:
- Send the alert to a specific Slack channel (
C01PROD) - Send the alert to a specific Telegram chat (
-987654321) - Enable on-call escalation with a shortened 1-minute wait time
SNS Listener
Versus can subscribe to an SNS topic and treat each message as an incoming incident. This is useful for CloudWatch Alarms which can publish to SNS on state changes.
docker run -d \
  -p 3000:3000 \
  -e SLACK_ENABLE=true \
  -e SLACK_TOKEN=your_slack_token \
  -e SLACK_CHANNEL_ID=your_channel_id \
  -e SNS_ENABLE=true \
  -e SNS_TOPIC_ARN=$SNS_TOPIC_ARN \
  -e SNS_HTTPS_ENDPOINT_SUBSCRIPTION=https://your-domain.com \
  -e AWS_ACCESS_KEY_ID=$AWS_ACCESS_KEY \
  -e AWS_SECRET_ACCESS_KEY=$AWS_SECRET_KEY \
  --name versus \
  ghcr.io/versuscontrol/versus-incident
Test with the AWS CLI:
aws sns publish \
  --topic-arn $SNS_TOPIC_ARN \
  --message '{"ServiceName":"test-service","Logs":"[ERROR] Test error","UserID":"U12345"}' \
  --region $AWS_REGION
A common real-world setup: CloudWatch Alarms → SNS topic → Versus → Slack/Telegram/Email with a custom CloudWatch-aware template.
AI Agent
Versus supports an opt-in AI SRE agent that reads your logs, metrics, and traces, learns what normal looks like, and only alerts you when something new and unexpected appears.
Configuration example with agent features:
name: versus
host: 0.0.0.0
port: 3000

# ... existing alert configurations ...

# Shared secret required for ALL admin endpoints (`/api/admin/*` and
# `/api/agent/*`). Sent by clients in the `X-Gateway-Secret` header.
gateway_secret: ${GATEWAY_SECRET}

# Storage backend for the pattern catalog, shadow log, and incident
# history. Only `file` is implemented today; `redis` and `database`
# are config stubs.
storage:
  type: file              # file | redis | database (env: STORAGE_TYPE)
  file:
    data_dir: ./data
    max_incidents: 1000   # rolling cap on persisted incidents

agent:
  enable: false # Use this to enable or disable the agent for all sources
  mode: training # Valid values: "training", "shadow", or "detect"
  poll_interval: 30s

  # Sources are kept in a separate file so they can be managed independently
  # (e.g. swap fixtures, per-environment lists). Path is resolved relative to
  # this config file. Override via env: AGENT_SOURCES_PATH.
  sources_path: ./agent_sources.yaml

  catalog:
    persist_interval: 30s
    auto_promote_after: 100 # In detect mode, this many sightings = "known"

  redaction:
    enable: true
    redact_ips: false
    extra_patterns: # Optional: extra regex rules to scrub before clustering
      - "(?i)password=\\S+"
      - "Authorization:\\s*Bearer\\s+\\S+"

  miner:
    similarity_threshold: 0.4
    tree_depth: 4
    max_children: 100

  regex:
    # Optional: tag any signal whose message matches this pattern
    # if none of the named rules below hit. Leave empty to disable.
    default_pattern: "(?i)error|exception|fatal|panic"
    # Named rules are tried first, in order. The first match wins.
    rules:
      - name: oom
        pattern: "(?i)out of memory|OOMKilled|java\\.lang\\.OutOfMemoryError"
      - name: db-timeout
        pattern: "(?i)(connection|query) timeout|deadlock detected"
      - name: auth-failure
        pattern: "(?i)401 unauthorized|invalid credentials|permission denied"

redis: # Required for the agent to persist source cursors across restarts
  host: ${REDIS_HOST}
  port: ${REDIS_PORT}
  password: ${REDIS_PASSWORD}
  db: 0
Explanation:
The agent section includes:
enable: Turn the agent on or off (default:false). When disabled, nothing extra runs.mode: How the agent behaves after it has learned your log patterns:training: observation only — the agent learns patterns and saves them, but sends no alerts.shadow: same as training, but also logs a note every time it would have sent an alert. Good for reviewing before going live.detect: the agent actively sends alerts for any pattern it has never seen before.
poll_interval: How often the agent checks your log sources for new entries.catalog: Where the agent stores the list of known patterns and how often to write updates. Storage is selected by the rootstorage:block.
Admin secret. All admin endpoints (
/api/admin/*and/api/agent/*) are protected by the root-levelgateway_secret(envGATEWAY_SECRET). Set it to any value you choose; clients send the same value in theX-Gateway-Secretheader. When no secret is configured the admin endpoints are not registered and the agent refuses to start.
-
redaction: Rules for automatically removing sensitive information (passwords, tokens, emails, etc.) from logs before the agent processes them. -
miner: Controls how aggressively the agent groups similar log lines together. The defaults work well for most setups. -
regex: Acts as a pre-filter for the agent. Only signals whose message matches at least one rule (a named entry underrulesordefault_pattern) are forwarded to the pattern miner and stored in the catalog.- Named
rulesare tried in order; the first match wins and tags the signal with thatname(stored asrule_nameon the pattern). - If no named rule hits,
default_patternis tried. Matches there are tagged withname=default. - To learn from every line, set
default_pattern: ".*". - To filter aggressively, set
default_pattern: ""(empty) and rely on your named rules.
- Named
-
sources_path: Path to a separate YAML file that lists the log sources the agent should read from. Resolved relative to the main config file. Override viaAGENT_SOURCES_PATH.
The sources file (default ./agent_sources.yaml) has a single top-level sources: list. Each entry needs name, type (file or elasticsearch), enable, plus a matching file: or elasticsearch: block:
sources:
  - name: prod-app
    type: elasticsearch
    enable: true
    elasticsearch:
      addresses:
        - https://es.example.internal:9200
      username: ${ES_USERNAME}
      password: ${ES_PASSWORD}
      index: "logs-app-*"
      time_field: "@timestamp"
      query: 'log.level:(error OR warn)'
      message_field: message
      page_size: 500

  - name: sample-app
    type: file
    enable: true
    file:
      path: ./local/resource/sample-app.log
      format: text
      from_beginning: true
The redis section is required when agent.enable is true. Redis stores the per-source cursor so the agent picks up where it left off after a restart.
For full integration walkthroughs see Enable AI Agent.
On-Call
Versus supports On-Call integrations with AWS Incident Manager and PagerDuty. Configuration example with on-call features:
name: versus
host: 0.0.0.0
port: 3000
public_host: https://your-ack-host.example # Required for on-call ack

# ... existing alert configurations ...

oncall:
  ### Enable overriding using query parameters
  # /api/incidents?oncall_enable=false => Set to `true` or `false` to enable or disable on-call for a specific alert
  # /api/incidents?oncall_wait_minutes=0 => Set the number of minutes to wait for acknowledgment before triggering on-call. Set to `0` to trigger immediately
  enable: false
  wait_minutes: 3 # If you set it to 0, on-call triggers immediately without checking for an acknowledgment

  aws_incident_manager:
    response_plan_arn: ${AWS_INCIDENT_MANAGER_RESPONSE_PLAN_ARN}

redis: # Required for on-call functionality
  insecure_skip_verify: true # dev only
  host: ${REDIS_HOST}
  port: ${REDIS_PORT}
  password: ${REDIS_PASSWORD}
  db: 0
The oncall section includes:
enable: A boolean to toggle on-call functionality for all incidents (default:false).initialized_only: Initialize the on-call subsystem but keep it disabled by default. Withtrue, on-call is triggered only for requests that explicitly include?oncall_enable=true.wait_minutes: Time in minutes to wait for an acknowledgment before escalating (default:3). Set to0to trigger immediately.provider: Which on-call provider to use ("aws_incident_manager"or"pagerduty").aws_incident_manager: Configuration for AWS Incident Manager when selected, includingresponse_plan_arnandother_response_plan_arns.pagerduty: Configuration for PagerDuty when selected, includingrouting_keyandother_routing_keys.
The redis section is required when oncall.enable or oncall.initialized_only is true. It stores the open-incident state needed for ack-or-escalate.
For provider-specific walkthroughs see On-Call setup with Versus.
Deploy on Kubernetes
This page covers running Versus Incident as plain Kubernetes manifests. For the packaged distribution see Helm Chart.
TL;DR for production: mount a
PersistentVolumeClaimat/app/dataand setGATEWAY_SECRET. Without those two, the admin dashboard is unavailable and incident history disappears on every pod restart.
Quick deploy
1. Create the secrets
kubectl create secret generic versus-secrets \
  --from-literal=gateway_secret=$GATEWAY_SECRET \
  --from-literal=slack_token=$SLACK_TOKEN \
  --from-literal=slack_channel_id=$SLACK_CHANNEL_ID
2. ConfigMap with config
# versus-config.yaml
apiVersion: v1
kind: ConfigMap
metadata:
  name: versus-config
data:
  config.yaml: |
    name: versus
    host: 0.0.0.0
    port: 3000
    public_host: https://versus.example.com  # external URL the dashboard uses

    gateway_secret: ${GATEWAY_SECRET}

    storage:
      type: file
      file:
        data_dir: /app/data         # mount a PVC here (see below)
        max_incidents: 1000

    alert:
      slack:
        enable: true
        token: ${SLACK_TOKEN}
        channel_id: ${SLACK_CHANNEL_ID}
kubectl apply -f versus-config.yaml
Using custom templates
If the default formatting doesn't suit your needs you can override any template by mounting your own file. Create a ConfigMap with your custom template(s) and mount them into the container:
# versus-custom-templates.yaml
apiVersion: v1
kind: ConfigMap
metadata:
  name: versus-custom-templates
data:
  slack_message.tmpl: |
    *🚨 Incident in {{.ServiceName}}*
    ----------
    *Severity:* {{.Severity}}
    *Environment:* {{.Environment}}
    ```{{.Logs}}```
    Owner <@{{.UserID}}> please investigate

  telegram_message.tmpl: |
    🚨 <b>Incident in {{.ServiceName}}</b>

    <b>Severity:</b> {{.Severity}}
    <b>Environment:</b> {{.Environment}}
    <pre>{{.Logs}}</pre>
    Owner please investigate
kubectl apply -f versus-custom-templates.yaml
Then update the Deployment to mount the custom templates and point the config at them:
# In the container spec:
          volumeMounts:
            - name: versus-config
              mountPath: /app/config/config.yaml
              subPath: config.yaml
            - name: custom-templates
              mountPath: /app/custom/slack_message.tmpl
              subPath: slack_message.tmpl
            - name: custom-templates
              mountPath: /app/custom/telegram_message.tmpl
              subPath: telegram_message.tmpl
            - name: versus-data
              mountPath: /app/data

# In the volumes section:
      volumes:
        - name: versus-config
          configMap:
            name: versus-config
        - name: custom-templates
          configMap:
            name: versus-custom-templates
        - name: versus-data
          persistentVolumeClaim:
            claimName: versus-data
And reference the mounted paths in config.yaml:
alert:
  slack:
    enable: true
    template_path: "/app/custom/slack_message.tmpl"
  telegram:
    enable: true
    template_path: "/app/custom/telegram_message.tmpl"
Persistent data store
Versus persists three things to disk via the file storage backend:
| File | Purpose |
|---|---|
incidents.json | Every incident received (rolling cap = max_incidents). |
patterns.json | AI-agent pattern catalog + services map. |
shadow.json | Append-only NDJSON log of shadow events. |
If you don't mount a volume, all three are written to the container's ephemeral filesystem and disappear on every pod restart, redeploy, or rescheduling event. The admin dashboard's incident history will look like it resets.
PersistentVolumeClaim
# versus-pvc.yaml
apiVersion: v1
kind: PersistentVolumeClaim
metadata:
  name: versus-data
spec:
  accessModes: ["ReadWriteOnce"]
  resources:
    requests:
      storage: 5Gi
  # storageClassName: gp3        # uncomment / set to your cluster's class
kubectl apply -f versus-pvc.yaml
Replicas vs. RWO. A
ReadWriteOncevolume binds to a single node. If you needreplicas > 1either (a) switch to aReadWriteManyclass (EFS, Filestore, Azure Files) so every pod writes to the same directory, or (b) keepreplicas: 1and use aRecreatedeployment strategy. Sharing one RWO PVC across multiple pods will cause file corruption.
Deployment
# versus-deployment.yaml
apiVersion: apps/v1
kind: Deployment
metadata:
  name: versus-incident
spec:
  replicas: 1                    # see PVC note above before bumping this
  strategy:
    type: Recreate
  selector:
    matchLabels:
      app: versus-incident
  template:
    metadata:
      labels:
        app: versus-incident
    spec:
      containers:
        - name: versus-incident
          image: ghcr.io/versuscontrol/versus-incident
          ports:
            - containerPort: 3000
          livenessProbe:
            httpGet:
              path: /healthz
              port: 3000
          readinessProbe:
            httpGet:
              path: /healthz
              port: 3000
          env:
            - name: GATEWAY_SECRET
              valueFrom:
                secretKeyRef:
                  name: versus-secrets
                  key: gateway_secret
            - name: SLACK_TOKEN
              valueFrom:
                secretKeyRef:
                  name: versus-secrets
                  key: slack_token
            - name: SLACK_CHANNEL_ID
              valueFrom:
                secretKeyRef:
                  name: versus-secrets
                  key: slack_channel_id
          volumeMounts:
            - name: versus-config
              mountPath: /app/config/config.yaml
              subPath: config.yaml
            - name: versus-data
              mountPath: /app/data
      volumes:
        - name: versus-config
          configMap:
            name: versus-config
        - name: versus-data
          persistentVolumeClaim:
            claimName: versus-data
---
apiVersion: v1
kind: Service
metadata:
  name: versus-service
spec:
  selector:
    app: versus-incident
  ports:
    - protocol: TCP
      port: 3000
      targetPort: 3000
kubectl apply -f versus-deployment.yaml
Exposing the dashboard
Set public_host in the config to the external URL clients (and the
admin dashboard's banner) should use. Then expose the Service via your
preferred path — Ingress, LoadBalancer, or kubectl port-forward for
local testing:
kubectl port-forward svc/versus-service 3000:3000
# open http://localhost:3000/
Next steps
- Admin Dashboard — what the UI surfaces and how to rebuild the bundled assets.
- Configuration — every config key, env var, and per-request query parameter.
- Helm Chart — packaged install.
Installing Versus Incident with Helm
This guide explains how to deploy Versus Incident using Helm, a package manager for Kubernetes.
Requirements
- Kubernetes 1.19+
- Helm 3.2.0+
- PV provisioner support in the underlying infrastructure (if persistence is required for Redis)
Installing the Chart
You can install the Versus Incident Helm chart using OCI registry:
helm install versus-incident oci://ghcr.io/versuscontrol/charts/versus-incident
Install with Custom Values
# Install with custom configuration from a values file
helm install \
  versus-incident \
  oci://ghcr.io/versuscontrol/charts/versus-incident \
  -f values.yaml
Upgrading an Existing Installation
# Upgrade an existing installation with the latest version
helm upgrade \
  versus-incident \
  oci://ghcr.io/versuscontrol/charts/versus-incident

# Upgrade with custom values
helm upgrade \
  versus-incident \
  oci://ghcr.io/versuscontrol/charts/versus-incident \
  -f values.yaml
Configuration
Quick Start Example
Here's a simple example of a custom values file:
# values.yaml
replicaCount: 2

alert:
  slack:
    enable: true
    token: "xoxb-your-slack-token"
    channelId: "C12345"
    messageProperties:
      buttonText: "Acknowledge Alert"
      buttonStyle: "primary"

  telegram:
    enable: false

  email:
    enable: false

  msteams:
    enable: false

  lark:
    enable: false
Important Parameters
| Parameter | Description | Default |
|---|---|---|
replicaCount | Number of replicas for the deployment (set to 1 when agent.enable=true or persistence is enabled) | 2 |
config.publicHost | Public URL for acknowledgment links | "" |
gatewaySecret | Shared secret for /api/admin/* and /api/agent/*. Empty value leaves admin routes unregistered. | "" |
storage.type | Storage backend (only file is implemented today) | "file" |
storage.file.dataDir | Directory for incidents, pattern catalog, detect log | "/app/data" |
storage.persistence.enabled | Mount a PVC at storage.file.dataDir | false |
agent.enable | Enable the AI SRE Agent | false |
agent.mode | training, shadow, or detect | "training" |
agent.ai.enable | Forward unknown / spike patterns to the LLM | false |
agent.ai.apiKey | OpenAI API key (stored in the chart Secret) | "" |
alert.slack.enable | Enable Slack notifications | false |
alert.slack.token | Slack bot token | "" |
alert.slack.channelId | Slack channel ID | "" |
alert.telegram.enable | Enable Telegram notifications | false |
alert.email.enable | Enable email notifications | false |
alert.msteams.enable | Enable Microsoft Teams notifications | false |
alert.lark.enable | Enable Lark notifications | false |
oncall.enable | Enable on-call functionality | false |
oncall.provider | On-call provider ("aws_incident_manager" or "pagerduty") | "aws_incident_manager" |
redis.enabled | Enable bundled Redis (required for on-call) | false |
Notification Channel Configuration
Slack
alert:
  slack:
    enable: true
    token: "xoxb-your-slack-token"
    channelId: "C12345"
    messageProperties:
      buttonText: "Acknowledge Alert"
      buttonStyle: "primary" # "primary" (blue), "danger" (red), or empty (default gray)
      disableButton: false
Telegram
alert:
  telegram:
    enable: true
    botToken: "your-telegram-bot-token"
    chatId: "your-telegram-chat-id"
alert:
  email:
    enable: true
    smtpHost: "smtp.example.com"
    smtpPort: 587
    username: "your-email@example.com"
    password: "your-password"
    to: "alerts@example.com"
    subject: "Incident Alert"
Microsoft Teams
alert:
  msteams:
    enable: true
    powerAutomateUrl: "your-power-automate-flow-url"
    otherPowerUrls:
      dev: "dev-team-power-automate-url"
      ops: "ops-team-power-automate-url"
Lark
alert:
  lark:
    enable: true
    webhookUrl: "your-lark-webhook-url"
    otherWebhookUrls:
      dev: "dev-team-webhook-url"
      prod: "prod-team-webhook-url"
On-Call Configurations
AWS Incident Manager
oncall:
  enable: true
  waitMinutes: 3
  provider: "aws_incident_manager"

  awsIncidentManager:
    responsePlanArn: "arn:aws:ssm-incidents::111122223333:response-plan/YourPlan"
    otherResponsePlanArns:
      prod: "arn:aws:ssm-incidents::111122223333:response-plan/ProdPlan"
      dev: "arn:aws:ssm-incidents::111122223333:response-plan/DevPlan"

redis:
  enabled: true
  auth:
    enabled: true
    password: "your-redis-password"
  architecture: standalone
  master:
    persistence:
      enabled: true
      size: 8Gi
PagerDuty
oncall:
  enable: true
  waitMinutes: 5
  provider: "pagerduty"

  pagerduty:
    routingKey: "your-pagerduty-routing-key"
    otherRoutingKeys:
      infra: "infrastructure-team-routing-key"
      app: "application-team-routing-key"
      db: "database-team-routing-key"

redis:
  enabled: true
  auth:
    enabled: true
    password: "your-redis-password"
  architecture: standalone
  master:
    persistence:
      enabled: true
      size: 8Gi
Redis Configuration
Redis is required for on-call functionality. The chart can either deploy its own Redis instance or connect to an external one.
External Redis
redis:
  enabled: false

externalRedis:
  host: "redis.example.com"
  port: 6379
  password: "your-redis-password"
  insecureSkipVerify: false
  db: 0
Custom Alert Templates
You can provide custom templates for each notification channel:
templates:
  slack: |
    *Critical Error in {{.ServiceName}}*
    ----------
    Error Details:
    ```
    {{.Logs}}
    ```
    ----------
    Owner <@{{.UserID}}> please investigate

  telegram: |
    🚨 <b>Critical Error Detected!</b> 🚨
    📌 <b>Service:</b> {{.ServiceName}}
    ⚠️ <b>Error Details:</b>
    {{.Logs}}
AWS Integrations
Versus Incident can receive alerts from aws sns systems:
AWS SNS
alert:
  sns:
    enable: true
    httpsEndpointSubscriptionPath: "/sns"
Uninstalling the Chart
To uninstall/delete the versus-incident deployment:
helm uninstall versus-incident
Admin Dashboard & Storage
The embedded admin dashboard (see Admin Dashboard) and the persistent incident store are first-class chart values from v1.4.0+.
# Required for the dashboard and every /api/admin/* and /api/agent/*
# endpoint. When empty the admin routes are not registered at all
# (no silent open surface). Generate with `openssl rand -hex 32`.
gatewaySecret: "my-strong-secret"

storage:
  type: file                  # only `file` is implemented today
  file:
    dataDir: /app/data        # holds incidents.json, patterns.json, etc.
    maxIncidents: 1000        # rolling cap

  # Persist the data dir so incident history and the agent catalog
  # survive pod restarts. When disabled an emptyDir is used.
  persistence:
    enabled: true
    size: 2Gi
    accessMode: ReadWriteOnce
    storageClassName: ""      # "" → cluster default
    # existingClaim: my-pvc   # bind to an existing PVC instead
⚠️ Single-writer. The file storage backend writes JSON files directly to disk, and the AI agent worker is single-writer to the pattern catalog and detect log. When you enable persistence or the agent, set
replicaCount: 1andautoscaling.enabled: false. The chart's pre-flight validation will refuse to render if you violate this.
AI SRE Agent
The chart can deploy the agent introduced in
AI Detect Mode. It is fully opt-in:
when agent.enable: false (the default) no extra resources are
created and no AI calls are made.
Minimum config — training mode
Run the agent in observe-only mode against a log file mounted into the pod:
replicaCount: 1                     # required while agent.enable=true
gatewaySecret: "my-strong-secret"

storage:
  type: file
  file:
    dataDir: /app/data
  persistence:
    enabled: true
    size: 2Gi

agent:
  enable: true
  mode: training                    # observe + build catalog only
  pollInterval: 30s
  newServiceGrace: 30m
  sources:
    - name: app-logs
      type: file
      enable: true
      file:
        path: /var/log/app.log
        from_beginning: false
Inspect the catalog after a few minutes:
kubectl exec -it deploy/versus-incident -- \
  curl -H "X-Gateway-Secret: my-strong-secret" \
       http://localhost:3000/api/agent/patterns
Detect mode (forward unknowns to the LLM)
Switch mode: detect and enable the AI analyzer. The API key is
written to the chart Secret and exposed as AGENT_AI_API_KEY:
agent:
  enable: true
  mode: detect
  ai:
    enable: true
    apiKey: "${OPENAI_API_KEY}"     # use --set or external secret in prod
    model: "gpt-4o-mini"
    temperature: 0.2
    maxTokens: 512
    maxCallsPerHour: 30             # 0 = unlimited
    cacheTtl: "1h"
Install with the secret on the command line so it never lands in a
checked-in values.yaml:
helm upgrade --install versus-incident \
  oci://ghcr.io/versuscontrol/charts/versus-incident \
  --version 1.4.1 \
  -f values.yaml \
  --set gatewaySecret="$(openssl rand -hex 32)" \
  --set agent.ai.apiKey="$OPENAI_API_KEY"
Every AI call is recorded in the detect log
(/app/data/detect.json, capped at 500 events) and viewable via
the API or the UI:
curl -H "X-Gateway-Secret: $SECRET" \
     http://versus-incident.local/api/agent/detect/stats
Mounting log files into the pod
The file source needs the log file accessible inside the container. Common patterns:
| Source | How to mount |
|---|---|
| App in the same pod | sidecar emits to a shared emptyDir, agent reads it |
| Node logs (e.g. journald) | hostPath volume + securityContext.fsGroup |
| Cloud log service | use the elasticsearch source instead of file |
For Elasticsearch, replace the source block:
agent:
  sources:
    - name: prod-logs
      type: elasticsearch
      enable: true
      elasticsearch:
        addresses: ["https://es.internal:9200"]
        api_key: "${ES_API_KEY}"
        index: "logs-prod-*"
        time_field: "@timestamp"
        message_field: "message"
        page_size: 500
Always pass apiKey / credentials via --set or an external Secret;
inline secrets in values.yaml end up in helm get values output.
Important agent parameters
| Parameter | Description | Default |
|---|---|---|
agent.enable | Master switch (requires replicaCount: 1) | false |
agent.mode | training, shadow, or detect | "training" |
agent.pollInterval | How often each source is pulled | "30s" |
agent.lookback | Initial backfill window on startup | "5m" |
agent.newServiceGrace | Implicit training window per new service | "30m" |
agent.ai.enable | Call the LLM (detect mode dry-runs without this) | false |
agent.ai.apiKey | OpenAI API key | "" |
agent.ai.model | Model identifier | "gpt-4o-mini" |
agent.ai.maxCallsPerHour | Per-hour rate limit (0 = unlimited) | 60 |
agent.ai.cacheTtl | TTL for the per-pattern AI result cache | "1h" |
agent.sources | Inline list of signal sources | [] |
Additional Resources
Advanced Template Tips
Table of Contents
Multi-Service Template
Handle multiple alerts in one template:
{{ $service := .source | replace "aws." "" | upper }}
📡 *{{$service}} Alert*

{{ if eq .source "aws.glue" }}
  🔧 Job: {{.detail.jobName}}
{{ else if eq .source "aws.ec2" }}
  🖥 Instance: {{.detail.instance-id}}
{{ end }}

🔗 *Details*: {{.detail | toJson}}
If the field does not exist when passed to the template, let's use the template's printf function to handle it.
{{ if contains (printf "%v" .source) "aws.glue" }}
🔥 *Glue Job Failed*: {{.detail.jobName}}

❌ Error:
```{{.detail.errorMessage}}```
{{ else }}
🔥 *Critical Error in {{.ServiceName}}*

❌ Error Details:
```{{.Logs}}```

Owner <@{{.UserID}}> please investigate
{{ end }}
Conditional Formatting
Highlight critical issues:
{{ if gt .detail.actualValue .detail.threshold }}
🚨 CRITICAL: {{.detail.alarmName}} ({{.detail.actualValue}}%)
{{ else }}
⚠️ WARNING: {{.detail.alarmName}} ({{.detail.actualValue}}%)
{{ end }}
Best Practices for Custom Templates
- Keep It Simple: Focus on the most critical details for each alert.
- Use Conditional Logic: Tailor messages based on event severity or type.
- Test Your Templates: Use sample SNS messages to validate your templates.
- Document Your Templates: Share templates with your team for consistency.
How to Customize Alert Messages from Alertmanager to Slack and Telegram
Table of Contents
- Configure Alertmanager Webhook
- Launch Versus with Slack/Telegram
- Test
- Advanced: Dynamic Channel Routing
- Troubleshooting Tips

In this guide, you'll learn how to route Prometheus Alertmanager alerts to Slack and Telegram using the Versus Incident, while fully customizing alert messages.
Configure Alertmanager Webhook
Update your alertmanager.yml to forward alerts to Versus:
route:
  receiver: 'versus-incident'
  group_wait: 10s

receivers:
- name: 'versus-incident'
  webhook_configs:
  - url: 'http://versus-host:3000/api/incidents' # Versus API endpoint
    send_resolved: false
    # Additional settings (if needed):
    # http_config:
    #   tls_config:
    #     insecure_skip_verify: true  # For self-signed certificates
For example, alert rules:
groups:
  - name: cluster
    rules:
      - alert: PostgresqlDown
        expr: pg_up == 0
        for: 0m
        labels:
            severity: critical
        annotations:
            summary: Postgresql down (instance {{ $labels.instance }})
            description: "Postgresql instance is down."
Alertmanager sends alerts to the webhook in JSON format. Here’s an example of the payload:
{
  "receiver": "webhook-incident",
  "status": "firing",
  "alerts": [
    {
      "status": "firing",
      "labels": {
        "alertname": "PostgresqlDown",
        "instance": "postgresql-prod-01",
        "severity": "critical"
      },
      "annotations": {
        "summary": "Postgresql down (instance postgresql-prod-01)",
        "description": "Postgresql instance is down."
      },
      "startsAt": "2023-10-01T12:34:56.789Z",
      "endsAt": "2023-10-01T12:44:56.789Z",
      "generatorURL": ""
    }
  ],
  "groupLabels": {
    "alertname": "PostgresqlDown"
  },
  "commonLabels": {
    "alertname": "PostgresqlDown",
    "severity": "critical",
    "instance": "postgresql-prod-01"
  },
  "commonAnnotations": {
    "summary": "Postgresql down (instance postgresql-prod-01)",
    "description": "Postgresql instance is down."
  },
  "externalURL": ""
}
Next, we will deploy Versus Incident and configure it with a custom template to send alerts to both Slack and Telegram for this payload.
Launch Versus with Slack/Telegram
Create a configuration file config/config.yaml:
name: versus
host: 0.0.0.0
port: 3000

alert:
  slack:
    enable: true
    token: ${SLACK_TOKEN}
    channel_id: ${SLACK_CHANNEL_ID}
    template_path: "/app/config/slack_message.tmpl"

  telegram:
    enable: true
    bot_token: ${TELEGRAM_BOT_TOKEN}
    chat_id: ${TELEGRAM_CHAT_ID}
    template_path: "/app/config/telegram_message.tmpl"
Create Slack and Telegram templates.
config/slack_message.tmpl:
🔥 *{{ .commonLabels.severity | upper }} Alert: {{ .commonLabels.alertname }}*

🌐 *Instance*: `{{ .commonLabels.instance }}`
🚨 *Status*: `{{ .status }}`

{{ range .alerts }}
📝 {{ .annotations.description }}
⏰ *Firing since*: {{ .startsAt | formatTime }}
{{ end }}

🔗 *Dashboard*: <{{ .externalURL }}|Investigate>
telegram_message.tmpl:
🚩 <b>{{ .commonLabels.alertname }}</b>

{{ range .alerts }}
🕒 {{ .startsAt | formatTime }}
{{ .annotations.summary }}
{{ end }}

<pre>
Status: {{ .status }}
Severity: {{ .commonLabels.severity }}
</pre>
Run Versus:
docker run -d -p 3000:3000 \
  -e SLACK_ENABLE=true \
  -e SLACK_TOKEN=xoxb-your-token \
  -e SLACK_CHANNEL_ID=C12345 \
  -e TELEGRAM_ENABLE=true \
  -e TELEGRAM_BOT_TOKEN=123:ABC \
  -e TELEGRAM_CHAT_ID=-456789 \
  -v ./config:/app/config \
  ghcr.io/versuscontrol/versus-incident
Test
Trigger a test alert using curl:
curl -X POST http://localhost:3000/api/incidents \
  -H "Content-Type: application/json" \
  -d '{
    "receiver": "webhook-incident",
    "status": "firing",
    "alerts": [
      {
        "status": "firing",
        "labels": {
          "alertname": "PostgresqlDown",
          "instance": "postgresql-prod-01",
          "severity": "critical"
        },
        "annotations": {
          "summary": "Postgresql down (instance postgresql-prod-01)",
          "description": "Postgresql instance is down."
        },
        "startsAt": "2023-10-01T12:34:56.789Z",
        "endsAt": "2023-10-01T12:44:56.789Z",
        "generatorURL": ""
      }
    ],
    "groupLabels": {
      "alertname": "PostgresqlDown"
    },
    "commonLabels": {
      "alertname": "PostgresqlDown",
      "severity": "critical",
      "instance": "postgresql-prod-01"
    },
    "commonAnnotations": {
      "summary": "Postgresql down (instance postgresql-prod-01)",
      "description": "Postgresql instance is down."
    },
    "externalURL": ""
  }'
Final Result:

Advanced: Dynamic Channel Routing
Override Slack channels per alert using query parameters:
POST http://versus-host:3000/api/incidents?slack_channel_id=EMERGENCY-CHANNEL
Troubleshooting Tips
- Enable debug mode:
DEBUG_BODY=true - Check Versus logs:
docker logs versus
If you encounter any issues or have further questions, feel free to reach out!
Configuring Fluent Bit to Send Error Logs to Versus Incident
Table of Contents
- Understand the Log Format
- Configure Fluent Bit Filters
- Configure Fluent Bit Output
- Full Fluent Bit Configuration Example
- Test the Configuration
- Conclusion

Fluent Bit is a lightweight log processor and forwarder that can filter, modify, and forward logs to various destinations. In this tutorial, we will configure Fluent Bit to filter logs containing [ERROR] and send them to the Versus Incident Management System using its REST API.
Understand the Log Format
The log format provided is as follows, you can create a sample.log file:
[2023/01/22 09:46:49] [ INFO ] This is info logs 1
[2023/01/22 09:46:49] [ INFO ] This is info logs 2
[2023/01/22 09:46:49] [ INFO ] This is info logs 3
[2023/01/22 09:46:49] [ ERROR ] This is error logs
We are interested in filtering logs that contain [ ERROR ].
Configure Fluent Bit Filters
To filter and process logs, we use the grep and modify filters in Fluent Bit.
Filter Configuration
Add the following configuration to your Fluent Bit configuration file:
# Filter Section - Grep for ERROR logs
[FILTER]
    Name    grep
    Match   versus.*
    Regex   log .*\[.*ERROR.*\].*

# Filter Section - Modify fields
[FILTER]
    Name    modify
    Match   versus.*
    Rename  log Logs
    Set     ServiceName order-service
Explanation
- Grep Filter:
- Matches all logs that contain
[ ERROR ]. - The
Regexfield uses a regular expression to identify logs with the[ ERROR ]keyword.
- Modify Filter:
- Adds or modifies fields in the log record.
- Sets the
ServiceNamefield for the default template. You can set the fields you want based on your template.
Default Telegram Template
🚨 <b>Critical Error Detected!</b> 🚨
📌 <b>Service:</b> {{.ServiceName}}
⚠️ <b>Error Details:</b>
{{.Logs}}
Configure Fluent Bit Output
To send filtered logs to the Versus Incident Management System, we use the http output plugin.
Output Configuration
Add the following configuration to your Fluent Bit configuration file:
...
# Output Section - Send logs to Versus Incident via HTTP
[OUTPUT]
    Name    http
    Match   versus.*
    Host    localhost
    Port    3000
    URI     /api/incidents
    Format  json_stream
Explanation
- Name: Specifies the output plugin (
httpin this case). - Match: Matches all logs processed by the previous filters.
- Host and Port: Specify the host and port of the Versus Incident Management System (default is
localhost:3000). - URI: Specifies the endpoint for creating incidents (
/api/incidents). - Format: Ensures the payload is sent in JSON Stream format.
Full Fluent Bit Configuration Example
Here is the complete Fluent Bit configuration file:
# Input Section
[INPUT]
    Name   tail
    Path   sample.log
    Tag    versus.*
    Mem_Buf_Limit 5MB
    Skip_Long_Lines On

# Filter Section - Grep for ERROR logs
[FILTER]
    Name    grep
    Match   versus.*
    Regex   log .*\[.*ERROR.*\].*

# Filter Section - Modify fields
[FILTER]
    Name    modify
    Match   versus.*
    Rename  log Logs
    Set     ServiceName order-service

# Output Section - Send logs to Versus Incident via HTTP
[OUTPUT]
    Name    http
    Match   versus.*
    Host    localhost
    Port    3000
    URI     /api/incidents
    Format  json_stream
Test the Configuration
Run Versus Incident:
docker run -p 3000:3000 \
  -e TELEGRAM_ENABLE=true \
  -e TELEGRAM_BOT_TOKEN=your_token \
  -e TELEGRAM_CHAT_ID=your_channel \
  ghcr.io/versuscontrol/versus-incident
Run Fluent Bit with the configuration file:
fluent-bit -c /path/to/fluent-bit.conf
Check the logs in the Versus Incident Management System. You should see an incident created with the following details:
Raw Request Body: {"date":1738999456.96342,"Logs":"[2023/01/22 09:46:49] [ ERROR ] This is error logs","ServiceName":"order-service"}
2025/02/08 14:24:18 POST /api/incidents 201 127.0.0.1 Fluent-Bit
Conclusion
By following the steps above, you can configure Fluent Bit to filter error logs and send them to the Versus Incident Management System. This integration enables automated incident management, ensuring that critical errors are promptly addressed by your DevOps team.
If you encounter any issues or have further questions, feel free to reach out!
Configuring CloudWatch to send Alert to Versus Incident
Table of Contents
- Create an SNS Topic
- Create a CloudWatch Alarm for RDS CPU
- Versus Incident
- Subscribe Versus to the SNS Topic
- Test the Integration
- Conclusion
In this guide, you’ll learn how to set up a CloudWatch alarm to trigger when RDS CPU usage exceeds 80% and send an alert to Slack and Telegram.
Prerequisites
AWS account with access to RDS, CloudWatch, and SNS. An RDS instance running (replace my-rds-instance with your instance ID). Slack and Telegram API Token.
Steps
-
Create SNS Topic and Subscription.
-
Create CloudWatch Alarm.
-
Deploy Versus Incident with Slack and Telegram configurations.
-
Subscribe Versus to the SNS Topic.
Create an SNS Topic
Create an SNS topic to route CloudWatch Alarms to Versus:
aws sns create-topic --name RDS-CPU-Alarm-Topic
Create a CloudWatch Alarm for RDS CPU
Set up an alarm to trigger when RDS CPU exceeds 80% for 5 minutes.
aws cloudwatch put-metric-alarm \
  --alarm-name "RDS_CPU_High" \
  --alarm-description "RDS CPU utilization over 80%" \
  --namespace AWS/RDS \
  --metric-name CPUUtilization \
  --dimensions Name=DBInstanceIdentifier,Value=my-rds-instance \
  --statistic Average \
  --period 300 \
  --threshold 80 \
  --comparison-operator GreaterThanThreshold \
  --evaluation-periods 1 \
  --alarm-actions arn:aws:sns:us-east-1:123456789012:RDS-CPU-Alarm-Topic
Explanation:
--namespace AWS/RDS: Specifies RDS metrics.--metric-name CPUUtilization: Tracks CPU usage.--dimensions: Identifies your RDS instance.--alarm-actions: The SNS topic ARN where alerts are sent.
Versus Incident
Next, we will deploy Versus Incident and configure it with a custom template to send alerts to both Slack and Telegram. Enable SNS support in config/config.yaml:
name: versus
host: 0.0.0.0
port: 3000

alert:
  debug_body: true

  slack:
    enable: true
    token: ${SLACK_TOKEN}
    channel_id: ${SLACK_CHANNEL_ID}
    template_path: "/app/config/slack_message.tmpl"

  telegram:
    enable: true
    bot_token: ${TELEGRAM_BOT_TOKEN}
    chat_id: ${TELEGRAM_CHAT_ID}
    template_path: "/app/config/telegram_message.tmpl"

queue:
  enable: true
  sns:
    enable: true
    https_endpoint_subscription_path: /sns
When your RDS_CPU_High alarm triggers, SNS will send a notification to your HTTP endpoint. The message will be a JSON object wrapped in an SNS envelope. Here’s an example of what the JSON payload of Message field might look like:
{
  "AlarmName": "RDS_CPU_High",
  "AlarmDescription": "RDS CPU utilization over 80%",
  "AWSAccountId": "123456789012",
  "NewStateValue": "ALARM",
  "NewStateReason": "Threshold Crossed: 1 out of the last 1 datapoints was greater than the threshold (80.0). The most recent datapoint: 85.3.",
  "StateChangeTime": "2025-03-17T12:34:56.789Z",
  "Region": "US East (N. Virginia)",
  "OldStateValue": "OK",
  "Trigger": {
    "MetricName": "CPUUtilization",
    "Namespace": "AWS/RDS",
    "StatisticType": "Statistic",
    "Statistic": "AVERAGE",
    "Unit": "Percent",
    "Period": 300,
    "EvaluationPeriods": 1,
    "ComparisonOperator": "GreaterThanThreshold",
    "Threshold": 80.0,
    "TreatMissingData": "missing",
    "Dimensions": [
      {
        "Name": "DBInstanceIdentifier",
        "Value": "my-rds-instance"
      }
    ]
  }
}
Create Slack and Telegram templates, e.g. config/slack_message.tmpl:
*🚨 CloudWatch Alarm: {{.AlarmName}}*
----------
Description: {{.AlarmDescription}}
Current State: {{.NewStateValue}}
Timestamp: {{.StateChangeTime}}
----------
Owner <@${USERID}>: Investigate immediately!
config/telegram_message.tmpl:
🚨 <b>{{.AlarmName}}</b>
📌 <b>Status:</b> {{.NewStateValue}}
⚠️ <b>Description:</b> {{.AlarmDescription}}
🕒 <b>Time:</b> {{.StateChangeTime}}
Deploy with Docker:
docker run -d \
  -p 3000:3000 \
  -v $(pwd)/config:/app/config \
  -e SLACK_ENABLE=true \
  -e SLACK_TOKEN=your_slack_token \
  -e SLACK_CHANNEL_ID=your_channel_id \
  -e TELEGRAM_ENABLE=true \
  -e TELEGRAM_BOT_TOKEN=your_token \
  -e TELEGRAM_CHAT_ID=your_channel \
  --name versus \
  ghcr.io/versuscontrol/versus-incident
Versus Incident is running and accessible at:
http://localhost:3000/sns
For testing purposes, we can use ngrok to enable the Versus on localhost that can be accessed via the internet.
ngrok http 3000 --url your-versus-https-url.ngrok-free.app
This URL is available to anyone on the internet.
Subscribe Versus to the SNS Topic
Subscribe Versus’s /sns endpoint to the topic. Replace versus-host with your deployment URL:
aws sns subscribe \
  --topic-arn arn:aws:sns:us-east-1:123456789012:RDS-CPU-Alarm-Topic \
  --protocol https \
  --notification-endpoint https://your-versus-https-url.ngrok-free.app/sns
Test the Integration
- Simulate high CPU load on your RDS instance (e.g., run intensive queries).
- Check the CloudWatch console to confirm the alarm triggers.
- Verify Versus Incident receives the SNS payload and sends alerts to Slack and Telegram.
Conclusion
By integrating CloudWatch Alarms with Versus Incident via SNS, you centralize alert management and ensure critical infrastructure issues are promptly routed to Slack, Telegram, or Email.
If you encounter any issues or have further questions, feel free to reach out!
How to Configure Sentry to Send Alerts to MS Teams
Table of Contents
- Set Up Microsoft Teams Integration (2025 Update)
- Deploy Versus Incident with MS Teams Enabled
- Configure Sentry with Integration Webhooks
- Test the Integration
- Conclusion
This guide will show you how to route Sentry alerts through Versus Incident to Microsoft Teams, enabling your team to respond to application issues quickly and efficiently.
Prerequisites
- Microsoft Teams channel with Power Automate or webhook permissions
- Sentry account with project owner permissions
Set Up Microsoft Teams Integration (2025 Update)
Microsoft has announced the retirement of Office 365 Connectors (including Incoming Webhooks) by the end of 2025. Versus Incident supports both the legacy webhook method and the new Power Automate Workflows method. We recommend using Power Automate Workflows for all new deployments.
Option 1: Set Up a Power Automate Workflow (Recommended)
Follow these steps to create a Power Automate workflow to receive alerts in Microsoft Teams:
- Sign in to Power Automate
- Click Create and select Instant cloud flow
- Name your flow (e.g., "Versus Incident Alerts")
- Select When a HTTP request is received as the trigger and click Create
- In the HTTP trigger, you'll see a generated HTTP POST URL. Copy this URL - you'll need it later
- Click + New step and search for "Teams"
- Select Post a message in a chat or channel (under Microsoft Teams)
- Configure the action:
- Choose Channel as the Post as option
- Select your Team and Channel
- For the Message field, add:
@{triggerBody()?['messageText']} - Click Save to save your flow
Option 2: Set Up an MS Teams Webhook (Legacy Method)
For backward compatibility, Versus still supports the traditional webhook method (being retired by end of 2025):
- Open MS Teams and go to the channel where you want alerts to appear.
- Click the three dots
(…)next to the channel name and select Connectors. - Find Incoming Webhook, click Add, then Add again in the popup.
- Name your webhook (e.g., Sentry Alerts) and optionally upload an image.
- Click Create, then copy the generated webhook URL. Save this URL — you'll need it later.
Deploy Versus Incident with MS Teams Enabled
Next, configure Versus Incident to forward alerts to MS Teams. Create a directory for your configuration files:
mkdir -p ./config
Create config/config.yaml with the following content for Power Automate (recommended):
name: versus
host: 0.0.0.0
port: 3000

alert:
  debug_body: true

  msteams:
    enable: false # Default value, will be overridden by MSTEAMS_ENABLE env var
    power_automate_url: ${MSTEAMS_POWER_AUTOMATE_URL} # Power Automate HTTP trigger URL
    template_path: "config/msteams_message.tmpl"
Create a custom MS Teams template in config/msteams_message.tmpl, for example, the JSON Format for Sentry Webhooks Integration:
{
  "action": "created",
  "data": {
    "issue": {
      "id": "123456",
      "title": "Example Issue",
      "culprit": "example_function in example_module",
      "shortId": "PROJECT-1",
      "project": {
        "id": "1",
        "name": "Example Project",
        "slug": "example-project"
      },
      "metadata": {
        "type": "ExampleError",
        "value": "This is an example error"
      },
      "status": "unresolved",
      "level": "error",
      "firstSeen": "2023-10-01T12:00:00Z",
      "lastSeen": "2023-10-01T12:05:00Z",
      "count": 5,
      "userCount": 3
    }
  },
  "installation": {
    "uuid": "installation-uuid"
  },
  "actor": {
    "type": "user",
    "id": "789",
    "name": "John Doe"
  }
}
Now, create a rich MS Teams template in config/msteams_message.tmpl:
**🚨 Sentry Alert: {{.data.issue.title}}**

**Project**: {{.data.issue.project.name}}

**Issue URL**: {{.data.issue.url}}

Please investigate this issue immediately.
This template uses Markdown to format the alert in MS Teams. It pulls data from the Sentry webhook payload (e.g., {{.data.issue.title}}).
Note about MS Teams notifications (April 2025): The system will automatically extract "Sentry Alert: {{.data.issue.title}}" as the summary for Microsoft Teams notifications, and generate a plain text version as a fallback. You don't need to add these fields manually - Versus Incident handles this to ensure proper display in Microsoft Teams.
Run Versus Incident using Docker, mounting your configuration files and setting the MS Teams Power Automate URL as an environment variable:
docker run -d \
  -p 3000:3000 \
  -v $(pwd)/config:/app/config \
  -e MSTEAMS_ENABLE=true \
  -e MSTEAMS_POWER_AUTOMATE_URL="your_power_automate_url" \
  --name versus \
  ghcr.io/versuscontrol/versus-incident
Replace your_power_automate_url with the URL you copied from Power Automate. The Versus Incident API endpoint for receiving alerts is now available at:
http://localhost:3000/api/incidents
Configure Sentry with Integration Webhooks
Versus Incident is specifically designed to work with Sentry Integration Webhooks - a feature that allows Sentry to send detailed issue data to external services when specific events occur. Here's how to set it up:
- Log in to your Sentry account and navigate to your project.
- Go to Settings → Integrations → Webhook.
- Click on Install (or Configure if already installed).
- Enter a name for your webhook (e.g., "Versus Incident").
- For the webhook URL, enter:
- If Versus is running locally:
http://localhost:3000/api/incidents - If deployed elsewhere:
https://your-versus-domain.com/api/incidents
- If Versus is running locally:
- Under Alerts, make sure Issue Alerts is checked.
- Under Services, check Issue to receive issue-related events.
- Click Save Changes.
Create Alert Rules with the Webhook Integration
Next, create alert rules that will use this webhook:
- Go to Alerts in the sidebar and click Create Alert Rule.
- Define the conditions for your alert, such as:
- When: "A new issue is created"
- Filter: (Optional) Add filters like "error level is fatal"
- Under Actions, select Send a notification via a webhook.
- Select the webhook you created earlier.
- Save the alert rule.
Sentry will now send standardized Integration webhook payloads to Versus Incident whenever the alert conditions are met. These payloads contain comprehensive issue details including stack traces, error information, and project metadata that Versus Incident can parse and format for MS Teams.
Test the Integration
To confirm everything works, simulate a Sentry alert using curl:
curl -X POST http://localhost:3000/api/incidents \
  -H "Content-Type: application/json" \
  -d '{
  "action": "created",
  "data": {
    "issue": {
      "id": "123456",
      "title": "Example Issue",
      "culprit": "example_function in example_module",
      "shortId": "PROJECT-1",
      "project": {
        "id": "1",
        "name": "Example Project",
        "slug": "example-project"
      },
      "metadata": {
        "type": "ExampleError",
        "value": "This is an example error"
      },
      "status": "unresolved",
      "level": "error",
      "firstSeen": "2023-10-01T12:00:00Z",
      "lastSeen": "2023-10-01T12:05:00Z",
      "count": 5,
      "userCount": 3
    }
  },
  "installation": {
    "uuid": "installation-uuid"
  },
  "actor": {
    "type": "user",
    "id": "789",
    "name": "John Doe"
  }
}'
Alternatively, trigger a real error in your Sentry-monitored application and verify the alert appears in MS Teams.
Conclusion
By connecting Sentry to MS Teams via Versus Incident, you've created a streamlined alerting system that keeps your team informed of critical issues in real-time. The Sentry Integration Webhook provides rich, detailed information about each issue, and Versus Incident's flexible templating system allows you to present this information in a clear, actionable format for your team.
Configure Kibana to Send Alerts to Slack and Telegram
Table of Contents
- Prerequisites
- Step 1: Set Up Slack and Telegram Bots
- Step 2: Deploy Versus Incident with Slack and Telegram Enabled
- Step 3: Configure Kibana Alerts with a Webhook
- Step 4: Test the Integration
- Conclusion
Kibana, part of the Elastic Stack, provides powerful monitoring and alerting capabilities for your applications and infrastructure. However, its native notification options are limited.
In this guide, we’ll walk through setting up Kibana to send alerts to Versus Incident, which will then forward them to Slack and Telegram using custom templates.
Prerequisites
- A running Elastic Stack (Elasticsearch and Kibana) instance with alerting enabled (Kibana 7.13+ required for the Alerting feature).
- A Slack workspace with permissions to create a bot and obtain a token.
- A Telegram account with a bot created via BotFather and a chat ID for your target group or channel.
- Docker installed (optional, for easy Versus Incident deployment).
Step 1: Set Up Slack and Telegram Bots
Slack Bot
- Visit api.slack.com/apps and click Create New App.
- Name your app (e.g., “Kibana Alerts”) and select your Slack workspace.
- Under Bot Users, add a bot (e.g., “KibanaBot”) and enable it.
- Go to OAuth & Permissions, add the
chat:writescope under Scopes. - Install the app to your workspace and copy the Bot User OAuth Token (starts with
xoxb-). Save it securely. - Invite the bot to your Slack channel by typing
/invite @KibanaBotin the channel and note the channel ID (right-click the channel, copy the link, and extract the ID).
Telegram Bot
- Open Telegram and search for BotFather.
- Start a chat and type
/newbot. Follow the prompts to name your bot (e.g., “KibanaAlertBot”). - BotFather will provide a Bot Token (e.g.,
123456:ABC-DEF1234ghIkl-zyx57W2v1u123ew11). Save it securely. - Create a group or channel in Telegram, add your bot, and get the Chat ID:
- Send a message to the group/channel via the bot.
- Use
https://api.telegram.org/bot<YourBotToken>/getUpdatesin a browser to retrieve thechat.id(e.g.,-123456789).
Step 2: Deploy Versus Incident with Slack and Telegram Enabled
Versus Incident acts as a bridge between Kibana and your notification channels. We’ll configure it to handle both Slack and Telegram alerts.
Create Configuration Files
- Create a directory for configuration:
mkdir -p ./config
- Create
config/config.yamlwith the following content:
name: versus
host: 0.0.0.0
port: 3000

alert:
  slack:
    enable: true
    token: ${SLACK_TOKEN}
    channel_id: ${SLACK_CHANNEL_ID}
    template_path: "/app/config/slack_message.tmpl"

  telegram:
    enable: true
    bot_token: ${TELEGRAM_BOT_TOKEN}
    chat_id: ${TELEGRAM_CHAT_ID}
    template_path: "/app/config/telegram_message.tmpl"
- Create a Slack template at
config/slack_message.tmpl:
🚨 *Kibana Alert: {{.name}}*

**Message**: {{.message}}
**Status**: {{.status}}
**Kibana URL**: <{{.kibanaUrl}}|View in Kibana>

Please investigate this issue.
- Create a Telegram template at
config/telegram_message.tmpl(using HTML formatting):
🚨 <b>Kibana Alert: {{.name}}</b>

<b>Message</b>: {{.message}}
<b>Status</b>: {{.status}}
<b>Kibana URL</b>: <a href="{{.kibanaUrl}}">View in Kibana</a>

Please investigate this issue.
Run Versus Incident with Docker
Deploy Versus Incident with the configuration and environment variables:
docker run -d \
  -p 3000:3000 \
  -v $(pwd)/config:/app/config \
  -e SLACK_ENABLE=true \
  -e SLACK_TOKEN="your_slack_bot_token" \
  -e SLACK_CHANNEL_ID="your_slack_channel_id" \
  -e TELEGRAM_ENABLE=true \
  -e TELEGRAM_BOT_TOKEN="your_telegram_bot_token" \
  -e TELEGRAM_CHAT_ID="your_telegram_chat_id" \
  --name versus \
  ghcr.io/versuscontrol/versus-incident
- Replace
your_slack_bot_tokenandyour_slack_channel_idwith Slack values. - Replace
your_telegram_bot_tokenandyour_telegram_chat_idwith Telegram values.
The Versus Incident API endpoint is now available at http://localhost:3000/api/incidents.
Step 3: Configure Kibana Alerts with a Webhook
Kibana’s Alerting feature allows you to send notifications via webhooks. We’ll configure it to send alerts to Versus Incident.
- Log in to Kibana and go to Stack Management > Alerts and Insights > Rules.
- Click Create Rule.
- Define your rule:
- Name: e.g., “High CPU Alert”.
- Connector: Select an index or data view to monitor (e.g., system metrics).
- Condition: Set a condition, such as “CPU usage > 80% over the last 5 minutes”.
- Check every: 1 minute (or your preferred interval).
- Add an Action:
- Action Type: Select Webhook.
- URL:
http://localhost:3000/api/incidents(or your deployed Versus URL, e.g.,https://your-versus-domain.com/api/incidents). - Method: POST.
- Headers: Add
Content-Type: application/json. - Body: Use this JSON template to match Versus Incident’s expected fields:
{
  "name": "{{rule.name}}",
  "message": "{{context.message}}",
  "status": "{{alert.state}}",
  "kibanaUrl": "{{kibanaBaseUrl}}/app/management/insightsAndAlerting/rules/{{rule.id}}"
}
- Save the rule.
Kibana will now send a JSON payload to Versus Incident whenever the alert condition is met.
Step 4: Test the Integration
Simulate a Kibana alert using curl to test the setup:
curl -X POST http://localhost:3000/api/incidents \
  -H "Content-Type: application/json" \
  -d '{
    "name": "High CPU Alert",
    "message": "CPU usage exceeded 80% on server-01",
    "status": "active",
    "kibanaUrl": "https://your-kibana-instance.com/app/management/insightsAndAlerting/rules/12345"
  }'
Alternatively, trigger a real alert in Kibana (e.g., by simulating high CPU usage in your monitored system) and confirm the notifications appear in both Slack and Telegram.
Conclusion
By integrating Kibana with Versus Incident, you can send alerts to Slack and Telegram with customized, actionable messages that enhance your team’s incident response. This setup is flexible and scalable—Versus Incident also supports additional channels like Microsoft Teams and Email, as well as on-call integrations like AWS Incident Manager.
If you encounter any issues or have further questions, feel free to reach out!
AI Agent — Introduction
The AI Agent is an SRE agent that watches your systems and points out anything that looks new or unusual. The plan is to cover the three signals an SRE cares about — logs, metrics, and traces — and over time take on more of the routine work an on-call engineer does.
Logs are the first thing it understands. It reads your application logs, learns what your "normal" log lines look like, and flags lines it has never seen before. The idea is simple: most log lines repeat themselves. If a brand-new line shows up, it usually means something new is happening, and you probably want to know. Metrics and traces will follow in later releases.

The agent is off by default (agent.enable: false). It will not
read anything, save any files, or start any background work until
you turn it on.
Why this is useful
Most logs in production are boring and repeat over and over. A handful of message shapes (templates) usually account for almost all of the volume. The agent learns those shapes from your real traffic and then points out anything that doesn't fit. You don't have to write rules upfront — you just let it watch for a while.
How a log line is processed
Each time the agent checks for new logs, every line goes through a short series of steps. If a step throws the line out, the next steps are skipped.

In plain words:
- Read a new log line from one of your sources (a file, an Elasticsearch index, etc.).
- Hide secrets. Tokens, API keys, passwords, and similar things are replaced before anything else looks at the line.
- Filter. Boring lines (
200 OK, health checks, debug noise) are dropped so they don't fill up the catalog. - Group. Lines that look the same are grouped together. The agent doesn't keep every line — only one entry per "shape" of message.
- Save. That group is saved, along with how many times it has been seen.
- Decide what to do based on the agent's mode: just learn (training), pretend to alert (shadow), or actually send an incident when the line is brand new (detect).
Parts of the agent
Each part has its own page with the full settings and examples.
1. Log sources
Where the agent reads logs from. Two kinds are supported today: a local file reader (for testing or simple setups) and an Elasticsearch reader (for production clusters). Both remember where they left off, so a restart never replays old lines or skips new ones.
2. Hiding secrets
Before anything else, the agent replaces sensitive values (JWTs, AWS keys, bearer tokens, emails, UUIDs, user agents, etc.) with a placeholder. This runs first so secrets never reach the rest of the agent or any external AI model.
3. Filter rules
A short list of named rules plus an optional catch-all
(default_pattern) decide which lines are worth learning from. Any
line that doesn't match anything is thrown away before grouping. Use
default_pattern: ".*" if you want the agent to learn from every
line.
4. Grouping (the miner)
The grouper looks at the words in each line and puts similar lines
together. The result is a template like
GET /api/users/<*> 200, where <*> stands for the parts that
change (IDs, timestamps, IPs, etc.). You can tune how strict the
grouping is.
5. Catalog
The agent's long-term memory. Every template it learns is saved
with: when it was first seen, when it was last seen, how many times
it has appeared, an average rate, the filter rule that matched it,
and any labels you add. The catalog is saved to
data/patterns.json.
6. The worker and modes
The worker is the loop that runs everything on a timer. There are three modes:
training— just watch and learn. No alerts.shadow— watch and learn, plus write a "would have alerted" log entry every time a line would have triggered an alert. Still no real alerts. Good for checking the agent's judgement before going live.detect— actually create incidents for lines the agent has never seen before. (AI-written summaries for those incidents are coming in a later release; today this mode only logs the decision.)
7. Admin endpoints
A small set of HTTP endpoints under /api/agent/* that let you
look at the catalog, label patterns as known, and flush state
during reviews. Every endpoint requires the X-Gateway-Secret
header.
Suggested rollout
- Run in training for a few days. Check that the catalog stops growing quickly and the templates make sense.
- Switch to shadow. Watch the
agent[shadow]: would alert ...log lines for one release cycle. - Switch to detect. Triage what the agent reports and keep labeling patterns through the admin endpoints.
Where to next
- Getting Started — a short walkthrough using the file reader and sample logs.
- Configuration — every setting, every environment variable.
- Deep dives: Hiding secrets · Filter rules · Grouping · Catalog.
AI Agent — Getting Started
This guide takes you from nothing to a running agent in training mode, reading from a local file and saving what it learns to disk.

By the end you'll have:
- The agent running in Docker on port
3000. - A
data/patterns.jsonfile that grows as the agent learns. - A way to look at what it learned through the admin endpoints.
- (Optional) A script that writes realistic test logs so you can play with it before pointing the agent at real data.
Reminder. The agent is off by default. Nothing in this guide happens until you set
AGENT_ENABLE=true.
Before you start
- Docker (or Podman) on your machine.
- A Redis instance the agent can reach. The agent uses Redis to
remember where it left off in each log source between restarts.
For a quick local test:
docker run -d --name versus-redis -p 6379:6379 redis:7. - About 5 minutes.
1. Make a working folder
Create a folder to hold the agent's settings, source list, and saved
data. Anything in here is yours — the agent only reads from
/app/config and writes to /app/data inside the container.
mkdir -p versus-agent/{config,data,logs}
cd versus-agent
You should end up with:
versus-agent/
├── config/
│   ├── config.yaml          # main settings (step 2)
│   └── agent_sources.yaml   # list of log sources (step 3)
├── data/                    # patterns.json is saved here
└── logs/                    # the file the agent will read
2. Write a small config.yaml
Copy this into config/config.yaml. Everything not related to the
agent is turned off so you can focus on training.
name: versus
host: 0.0.0.0
port: 3000

alert:
  debug_body: true
  # All channels off — you don't need them for training.

queue:
  enable: false

oncall:
  enable: false

redis:
  host: ${REDIS_HOST}
  port: ${REDIS_PORT}
  password: ${REDIS_PASSWORD}
  db: 0

# Shared secret for ALL admin endpoints (`/api/admin/*` and `/api/agent/*`).
gateway_secret: ${GATEWAY_SECRET}      # any string you choose

# Storage backend for the agent catalog, shadow log, and incident history.
storage:
  type: file
  file:
    data_dir: /app/data                # patterns.json + shadow.json + incidents.json live here
    max_incidents: 1000

agent:
  enable: true                # turn the agent on
  mode: training              # just watch and learn — no alerts
  poll_interval: 10s
  lookback: 5m

  redaction:
    enable: true
    redact_ips: false

  catalog:
    persist_interval: 30s
    auto_promote_after: 100   # after this many sightings, treat as known

  miner:
    similarity_threshold: 0.4
    tree_depth: 4
    max_children: 100

  regex:
    # In training, this controls "what counts as interesting?".
    # ".*" → learn from every line (good for the first run).
    # Leave the rules empty for now; you can add them later.
    default_pattern: ".*"
    rules: []
3. Write agent_sources.yaml
The list of log sources lives in a sibling file agent_sources.yaml
next to your main config.yaml. The file is optional. For training,
point it at a single local log file.
sources:
  - name: my-app
    type: file
    enable: true
    file:
      path: /app/logs/my-app.log
      format: text             # "text" or "json"
      from_beginning: true     # read the whole file on first start
4. Run with Docker
Mount four things from your machine: the two config files, the data
folder (so patterns.json survives restarts), and the logs folder
(so the agent can read your application's log file).
docker run -d \
  --name versus-agent \
  -p 3000:3000 \
  -v "$PWD/config:/app/config:ro" \
  -v "$PWD/data:/app/data" \
  -v "$PWD/logs:/app/logs:ro" \
  -e AGENT_ENABLE=true \
  -e AGENT_MODE=training \
  -e GATEWAY_SECRET=change-me \
  -e REDIS_HOST=host.docker.internal \
  -e REDIS_PORT=6379 \
  -e REDIS_PASSWORD= \
  ghcr.io/versuscontrol/versus-incident:latest
On Linux, replace
host.docker.internalwith your host IP, or run Redis in the same Docker network and use its container name.
Watch the logs:
docker logs -f versus-agent
You should see:
agent: starting worker mode=training sources=1 poll=10s catalog=/app/data/patterns.json
If there are no log lines yet, the agent just waits and checks
again every poll_interval. To give it something to read, jump to
the next section.
5. (Optional) Generate fake logs to test
Before pointing the agent at real production data, it's worth
checking the whole thing works end to end on your machine. The repo
has two scripts in scripts/:
generate_noisy_logs.py— writes one batch of realistic INFO / WARN / ERROR lines.run_noisy_logs.sh— keeps appending fresh batches at a fixed interval, so the agent (which is reading the file) sees live traffic.
Copy the scripts folder, then:
# one-shot: write 2000 lines into the file the agent is reading
python3 scripts/generate_noisy_logs.py \
  --output ./logs/my-app.log \
  --lines 2000 --seed 42

# OR live: append 20 lines every 5 seconds, forever (Ctrl+C to stop)
./scripts/run_noisy_logs.sh \
  --output ./logs/my-app.log \
  --interval 5 --batch 20
Within a few seconds you should see lines like:
agent: new pattern p-abc123 (source=my-app tag=default) → service=api-gateway method=GET path=<*> status=200 …
agent: tick my-app signals=20 matched=20 patterns=8 skipped_no_match=0 verdicts=map[learned:8] cursor=…
Each "new pattern" line is a brand-new template the agent just added to the catalog. After a minute or two the rate of new patterns drops sharply — that's the agent reaching steady state.
For the full reference on the helper scripts (Elasticsearch source,
makelogs, Docker auto-start, etc.) see scripts/README.md
in the repo.
6. Look at what the agent learned
The admin endpoints need the X-Gateway-Secret header you set in
step 4 (GATEWAY_SECRET).
# Catalog summary
curl -H "X-Gateway-Secret: change-me" \
  http://localhost:3000/api/agent/status | jq

# Every learned pattern, sorted by how often it has been seen
curl -H "X-Gateway-Secret: change-me" \
  http://localhost:3000/api/agent/patterns | jq

# Look at one pattern in detail
curl -H "X-Gateway-Secret: change-me" \
  http://localhost:3000/api/agent/patterns/p-abc123 | jq
The patterns.json file in ./data/ is updated every
catalog.persist_interval (default 30s). It survives restarts and
can be copied between environments.
7. Switch to your real log file
Once you trust the catalog, replace the test file with the real one:
- Stop the agent:
docker stop versus-agent. - Edit
config/agent_sources.yamlsofile.pathpoints at your application's log file (mount it read-only into/app/logs). - (Optional) Delete the old test catalog so the agent starts
fresh:
rm -f data/patterns.json. - Start the agent again.
After a few days in training, when the new-pattern rate has
flattened, switch AGENT_MODE to shadow and watch the
"would-have-alerted" entries collect at GET /api/agent/shadow
for one release cycle before going to detect. See
Shadow Mode for the review steps.
Common questions
Q: How long should I leave the agent in training?
Until new patterns stop showing up often. For a small service it's
usually a few days; for a large setup it can be a week or two.
Watch the agent: new pattern … lines in stdout — when they slow
to a trickle over a full release cycle, you're ready for shadow
mode.
Q: Does training mode send any alerts?
No. Training only watches. The agent learns templates and saves
them to patterns.json. No Slack, no email, no on-call.
Q: Where does patterns.json live and what's in it?
At <storage.file.data_dir>/patterns.json (default data/patterns.json). Each
entry is one pattern: ID, the template the agent learned, when it
was first and last seen, how many times it has been seen, an
average rate, the filter rule that matched it, and any labels you
add.
Q: What if my log file rotates? The file reader notices rotation by comparing the file's current size to the saved position. When the file shrinks (a fresh log after rotation), it starts again from the beginning. No special setup needed.
Q: Do I need Redis?
Yes, when the agent is on. Redis stores per-source bookmarks so
the agent picks up exactly where it left off across restarts.
Without Redis, every restart would either replay your lookback
window or miss entries written while the agent was down. The file
reader also writes a small bookmark file as a fallback for local
testing, but Elasticsearch and other sources rely on Redis.
Q: My catalog is full of patterns I don't care about — how do I clean up? Three ways, easiest first:
- Make
agent.regex.default_patternstricter (or set it to empty and only use named rules) so noisy lines never reach the grouper. - Delete bad patterns one by one:
DELETE /api/agent/patterns/<id>. - Wipe and start over: stop the agent, delete
data/patterns.json*, start it again. You'll lose your training history.
Q: Can I run multiple agents against the same Redis?
Yes, as long as the source names are different (bookmark keys
include the source name). Each agent should have its own
storage.file.data_dir so they don't fight over patterns.json.
Q: What's the smallest config I can run with?
Roughly: root-level gateway_secret=…, agent.enable=true, plus
a redis block and a sibling agent_sources.yaml listing at least
one source. Everything else has sensible defaults.
What's next
- Shadow Mode — the next step after training: review what the agent would have alerted on without actually sending anything.
- Configuration — every setting and environment variable.
- Hiding secrets, Filter rules, Grouping, Catalog — deep dives.
- Introduction — overview and rollout plan.
AI Agent — Shadow Mode
Shadow mode is the practice run between training and detect. The agent keeps learning, and on top of that it decides what it would have alerted on — and writes those decisions to a file you can read later. It does not send any alerts.
Think of it as: "show me what you would have woken me up for, so I can decide if I trust you."
When to switch to shadow
Stay in training until new patterns stop showing up often —
usually a few days for a small service, longer for a large setup.
Then switch the mode:
docker stop versus-agent
docker run -d \
  --name versus-agent \
  ... \
  -e AGENT_MODE=shadow \
  ghcr.io/versuscontrol/versus-incident:latest
Or change agent.mode in config.yaml and restart.
The catalog and the shadow log live next to each other under the
storage backend's data_dir (root-level storage.file.data_dir):
data/
├── patterns.json     # learned templates (kept growing in shadow)
└── shadow.json       # would-have-alerted entries (only written in shadow)
How shadow mode works
Shadow mode runs the same steps as training (read → hide secrets →
filter → group → save) and adds one extra step at the end:
look at the result and, if it isn't already known, write a row to
shadow.json.

Three things to remember:
- The catalog still grows. Every line that passes the secret hider and the filter rules is added to the catalog, just like in training. Switching to shadow doesn't pause learning.
- The new step is just a check. A pattern is "known" when
either (a) you labeled it
knownthrough the admin API, or (b) it has been seen at leastauto_promote_aftertimes. Anything else is "unknown" and ends up in the shadow log. - No real alerts. Would-have-alerted entries land in
shadow.json(saved on disk, read through the API) and also print a green line in stdout.
What gets recorded
Every time the agent checks for new logs, each line that survives the earlier steps falls into one of three buckets:
- Known — quietly update the catalog and move on. This is what most lines do once the agent has trained.
- Unknown — write a row to the shadow log. This happens for a
brand-new template, or for a rare template that hasn't been
seen
auto_promote_aftertimes yet. - Spike — a known pattern that is suddenly firing way more
often than usual. The agent keeps an average rate (an EWMA) for
every pattern; when one tick blows past that average by a
configurable factor, the row is written to the shadow log with
verdict: spike. Useful for spotting sudden surges that the "known" check would otherwise hide.
A pattern is "known" when either of these is true:
- You've labeled it as known through
POST /api/agent/patterns/<id>with body{"verdict":"known"}. This takes effect right away and stays until you change it. - It has been seen at least
agent.catalog.auto_promote_aftertimes (default100). The agent saves this auto-promotion topatterns.jsonso you can check which patterns it considers baseline.
When a known pattern can still fire (spike)
"Known" usually means "ignore". But there's one case where you
probably still want to know: a pattern that has been quiet
suddenly going loud. The agent keeps an average rate (an EWMA) of
how often each pattern fires per tick, and compares the current
tick to that average. If the current tick is way above the
average, the row is written to the shadow log with
verdict: spike instead of being silenced.
Three settings control this:
agent.catalog.spike_multiplier(default5.0) — how many times above the baseline a tick must be. Set to0to disable spike detection.agent.catalog.spike_min_frequency(default5) — the current tick must have at least this many matches. Stops the agent from screaming when the baseline is0.5and one tick has 3 matches (technically 6× but not interesting).agent.catalog.spike_min_baseline_count(default20) — the pattern must have been seen this many times overall before it's eligible for a spike. Stops a barely-seen pattern's first big tick from looking like a spike before any real baseline has been built.
In practice: with the defaults, a pattern that normally fires once
or twice per tick suddenly producing 10+ matches in a single tick
will land in the shadow log as a spike, even if you previously
labeled it known.
One row per pattern, not per line
If the agent wrote one row for every flagged line, a busy cluster
would drown the shadow log. Instead, the log keeps one row per
(source, pattern_id) pair. When the same pattern is hit again,
that row is updated:
count+= new lines seen this tick (the raw count).occurrences+= 1 (one tick = one occurrence, no matter how many lines fired).templateis refreshed if the grouper improved it.last_seenis set to now (UTC).rule_nameis upgraded if a more specific filter rule now matches.
So if 200 NTP-skew lines arrive across 4 ticks, you don't get 200
rows — you get one row with count: 200, occurrences: 4.
Every recorded field
| Field | Meaning | Example |
|---|---|---|
pattern_id | Stable ID. Same as in the catalog, so you can look it up there. | p-9c2f01 |
template | Latest template. <*> marks the parts that change. | kernel: Out of memory: Killed process <*> (<*>) score 999 … |
source | The source name from agent_sources.yaml. Lets you tell prod from staging at a glance. | my-app |
rule_name | Filter rule that matched. default means the catch-all matched but no named rule did. Empty when filtering is off. | oom-killer / default |
verdict | unknown for first sightings, spike for known patterns whose tick frequency exceeds the EWMA baseline by spike_multiplier. | unknown / spike |
sample_message | One example line, with secrets already hidden, cut off at 512 bytes. | kernel: Out of memory: Killed process 1842 (versus-worker) score 999 … |
count | Total raw lines across every tick this row covers. | 17 |
occurrences | How many distinct ticks fired. Always ≤ count. | 3 |
first_seen | UTC time the row was first added. | 2026-04-30T18:21:04Z |
last_seen | UTC time of the most recent hit. Used for sorting and for cleanup. | 2026-04-30T18:31:42Z |
Size limit and cleanup
The shadow log holds at most 1000 different (source, pattern_id)
pairs (currently fixed). When it's full, the row with the oldest
last_seen is dropped to make room. You shouldn't hit this on a
normal-sized service: 1000 different anomalies in a single review
window means something is very wrong (or the filter rules are
too loose — see Filter rules).
shadow.json is written safely (write to a temp file, then rename),
so you can cat it from disk while the agent is running without
risking a half-written read.
Stdout mirror
You'll also see a green line in the agent's logs every time a row is recorded:
agent[shadow]: would alert pattern=p-abc123 tag=default verdict=unknown freq=4
freq is the per-tick count — the same number that gets added
to count in the JSON. Use stdout for live debugging while you're
tuning filter rules; use the API for review.
Try it locally with the noisy-logs script
If you went through Getting Started, you
already have the agent running against ./logs/my-app.log with
from_beginning: true. The repo has a
scripts/generate_noisy_logs.py script that mixes about 30
common templates with a few rare, production-style oddities (kernel
OOM with score, segfaults, expired TLS certs, NTP clock skew, lost
Raft quorum, replication lag, unexpected SIGTERM, …). Those rare
lines are exactly what shadow mode is meant to catch.
Step 1 — train on the boring baseline. With the agent in
training, point the live script at the log file and let it run
for a few minutes:
./scripts/run_noisy_logs.sh \
  --output ./logs/my-app.log \
  --interval 1 --batch 50
Watch the agent logs: the agent: new pattern lines should slow
down within a minute or two. That's your baseline.
Step 2 — switch to shadow mode. Stop the container, start it
again with AGENT_MODE=shadow. The catalog you just built is
saved to disk (data/patterns.json), so the agent already knows
what "normal" looks like.
Step 3 — keep generating logs. Restart the live script (or just leave it running). Most of what comes through is now the boring baseline, which the agent treats as known. The rare lines end up in the shadow log:
agent[shadow]: would alert pattern=p-9c2f01 tag=default verdict=unknown freq=1
agent[shadow]: would alert pattern=p-7e1a44 tag=default verdict=unknown freq=2
Step 4 — review. After a minute or two, hit the admin endpoint:
curl -H "X-Gateway-Secret: $SECRET" \
  http://localhost:3000/api/agent/shadow | jq '.events[] | {template, count, occurrences}'
You'll see entries like:
{ "template": "service=notifier message=\"x509 certificate expired\" host=<*> expired_at=<*> chain_position=<*>", "count": 1, "occurrences": 1 }
This is the "what you would have been alerted about" version. Use the loop in A typical review loop below to triage them.
Tip. Want a forced demo? Append a single batch of mostly baseline + anomalies to the file the agent is reading while in shadow mode:
python3 scripts/generate_noisy_logs.py \
  --append --start-time now \
  --output ./logs/my-app.log --lines 500
500 lines at default weights gives about 25 anomaly lines across ~10 different templates — a tidy worked example.
Reading the shadow log
The /api/agent/shadow* endpoints are how you actually use the
log. They're admin-only — every request needs the
X-Gateway-Secret header (set with GATEWAY_SECRET). The
examples below assume you saved that value into a shell variable:
export SECRET=change-me # whatever you set as GATEWAY_SECRET
All responses are JSON; piping to jq (or python -m json.tool)
makes them easier to read.
List every entry (most recent first)
Start here. The endpoint returns every distinct (source, pattern_id) the agent flagged in the current window, sorted by
last_seen so the freshest noise is on top:
curl -H "X-Gateway-Secret: $SECRET" \
  http://localhost:3000/api/agent/shadow | jq
Sample output:
{
  "events": [
    {
      "pattern_id": "p-abc123",
      "template": "GET /api/users/<*> 500",
      "source": "my-app",
      "rule_name": "default",
      "verdict": "unknown",
      "sample_message": "GET /api/users/42 500",
      "count": 17,
      "occurrences": 3,
      "first_seen": "2026-04-30T18:21:04Z",
      "last_seen": "2026-04-30T18:31:42Z"
    }
  ]
}
The two numbers to watch:
count— how many raw lines matched. Highcount+ lowoccurrencesmeans a brief flurry; high in both means a steady drip you should look at.occurrences— how many distinct ticks the pattern fired in. Each tick is one polling cycle (agent.poll_interval).
If you only want to see something specific, pipe through jq:
# templates and counts only
curl -s -H "X-Gateway-Secret: $SECRET" http://localhost:3000/api/agent/shadow \
  | jq '.events[] | {template, count, rule_name}'

# everything tagged "oom"
curl -s -H "X-Gateway-Secret: $SECRET" http://localhost:3000/api/agent/shadow \
  | jq '.events[] | select(.rule_name == "oom")'
Summary stats
Useful for dashboards or a quick "is this getting better?" check between review rounds:
curl -H "X-Gateway-Secret: $SECRET" \
  http://localhost:3000/api/agent/shadow/stats | jq
{
  "events": 12,
  "total_signals": 248,
  "total_occurrences": 41,
  "verdict_unknown": 12,
  "verdict_spike": 0
}
What each number means:
events— distinct(source, pattern_id)pairs in the log.total_signals— sum ofcountacross every entry. The raw volume.total_occurrences— sum ofoccurrences. Roughly: "how many ticks would have paged me?".verdict_unknown/verdict_spike— breakdown by label. Spike rows are known patterns whose tick frequency exceeded the configured threshold; unknown rows are first sightings.
A healthy review cycle drives events and total_occurrences
down over time, even as total_signals stays flat (because
you're labeling the boring patterns as known).
Force-save to disk
The worker only writes shadow.json every
catalog.persist_interval (default 30s) so it doesn't hammer the
disk. If you need a snapshot right now — to copy the file out
of a container, attach to a bug report, or just check what would
land on disk — ask the agent to save:
curl -X POST -H "X-Gateway-Secret: $SECRET" \
  http://localhost:3000/api/agent/shadow/flush
Does nothing if the log is already saved (shadow_dirty: false).
Clear the log
Once you've reviewed a batch and either labeled the patterns as known or fixed the underlying bug, drop the log so the next round starts from zero:
curl -X DELETE -H "X-Gateway-Secret: $SECRET" \
  http://localhost:3000/api/agent/shadow
This also saves the empty file so a restart doesn't bring the old entries back. The catalog is left alone — every learned pattern stays exactly where it was. You're only emptying the "would have alerted" inbox.
Status endpoint
A cheap health check that tells you both stores at a glance:
curl -H "X-Gateway-Secret: $SECRET" \
  http://localhost:3000/api/agent/status | jq
{
  "patterns": 87,
  "dirty": false,
  "shadow_events": 12,
  "shadow_dirty": true
}
patterns— number of entries in the catalog.dirty— catalog has changes that haven't been saved yet.shadow_events— distinct entries in the shadow log right now.shadow_dirty— same idea for the shadow log.
If shadow_events stops growing and shadow_dirty stays false
for many ticks, the agent has nothing new to flag — a good sign
you're getting close to ready for detect mode.
A typical review loop
This is the pattern you'll repeat for as long as the agent is in shadow mode. Each pass should make the next one quieter.
- Run shadow mode for about 24 hours. Long enough to cover at least one full traffic cycle (peak hours, off-peak, any nightly cron jobs).
- Pull the entries.
GET /api/agent/shadowand skim them. Sort them in your head into three groups: real anomalies you'd want to be paged about, noise that should have been silenced, and "new but legitimate" patterns (fresh deploys, new endpoints, etc.). - For things you would want to be paged about:
-
Add or improve a rule under
agent.regex.rulesinconfig.yamlso the pattern gets the rightnamenext time. -
Example: a
quorum lostline that landed withrule_name: defaultdeserves its own rule:agent: regex: rules: - name: quorum-lost pattern: "(?i)quorum lost"
-
- For things that are just noise:
-
Either raise
agent.catalog.auto_promote_after(default 100) so the pattern becomes "known" sooner, or label it as known by hand:curl -X POST -H "X-Gateway-Secret: $SECRET" \ -H "Content-Type: application/json" \ -d '{"verdict":"known","tags":["benign-validation-error"]}' \ http://localhost:3000/api/agent/patterns/p-abc123Once
verdict == "known", that pattern will never appear in the shadow log again, no matter how often it shows up.
-
- Clear the log:
DELETE /api/agent/shadow. The next round starts clean. - Repeat until the shadow log is mostly empty over a full release cycle (one or two weeks).
- Switch to detect. Set
AGENT_MODE=detectand you're live.
Common questions
Q: Will shadow mode send any alerts?
No. Not Slack, Telegram, email, on-call — nothing. It only writes
to shadow.json and stdout.
Q: Does shadow mode keep adding patterns to the catalog? Yes. Every line that passes the secret hider and filter rules is grouped and saved, exactly like in training. This is on purpose: shadow is "training plus a check" so you don't lose ground while reviewing.
Q: What happens if I switch back to training?
The shadow log is kept on disk and in memory; the worker just
stops adding to it. Switch back to shadow later and it picks up
where it left off.
Q: Can the shadow log fill up forever?
No. It holds at most 1000 distinct (source, pattern_id) pairs.
When full, the oldest-by-last_seen is dropped to make room. The
limit is currently fixed.
Q: Is shadow.json safe to delete by hand?
Yes — but only while the agent is stopped, and it'll come back on
the next tick anyway.
What's next
- Configuration — every setting and environment variable.
- Catalog — labeling patterns from the shadow log.
- Filter rules — tuning what reaches the grouper so shadow noise stays manageable.
AI Agent — Detect Mode
Detect mode is the go-live step. The agent classifies log patterns the same way it does in shadow, and when something genuinely new or anomalous shows up it asks an AI SRE to triage it and emits a real incident through the normal pipeline — so every channel you have configured (Slack, Telegram, Teams, Lark, Viber, Email, …) fires, and on-call escalation kicks in if enabled.
Think of it as: "shadow mode, but with a hand on the alert button — and the AI writes the page."
When to switch to detect
You're ready when all of these are true:
- The catalog has stopped growing fast (new patterns are rare).
- You've spent at least one release cycle in shadow and reviewed
the entries at
GET /api/agent/shadow. - You've labelled the obvious noisy patterns as
knownso they don't wake you up:POST /api/agent/patterns/<id>with{"verdict":"known"}. - You have an OpenAI-compatible API key.
Detect mode is opt-in twice:
agent.enable: trueANDagent.mode: detectANDagent.ai.enable: true. With the AI disabled, the worker still classifies signals but never calls a model — every detect outcome is recorded asdry.
How detect mode works
The pipeline is the same as shadow mode for the first few steps:

The detect tail does five things in order, all visible in the
per-tick log under the verdicts map:
- Dry guard — if the AI is not configured, log
emit_dryand stop. The worker still updated the catalog. - Cache lookup — keyed by
pattern_id. A hit reuses the previous AI finding without paying for another call. Counted asemit_cached. - Rate guard —
agent.ai.max_calls_per_hour. Stops a noisy day from running up an OpenAI bill. Counted asemit_quota. - Analyze — one
chat/completionscall against the model inagent.ai.model. The system prompt is assembled frompkg/agent/ai/prompts/*.md(SOUL,INPUTS,OUTPUT,RULES); the user prompt carries the redacted sample, template, frequency, baseline, and verdict. - Emit — the AI's
AIFinding(severity, summary, category, confidence, suggestions) is mapped into the standard incident content map and pushed. All per-channel templates and the on-call workflow trigger unchanged. Counted asemit_emitted.
Failures at step 4 or 5 land as emit_ai_error or
emit_send_error so you can spot misconfigured keys / channels
without grepping stack traces.
Configuration
The detect-specific block lives under agent.ai in
config.yaml:
agent:
  enable: true
  mode: detect

  ai:
    enable: true                       # opt in to live AI calls
    api_key: ${AGENT_AI_API_KEY}       # OpenAI-compatible bearer key
    model: gpt-4o-mini                 # any chat-completions model
    temperature: 0.2
    max_tokens: 800
    max_calls_per_hour: 60             # 0 = unlimited
    cache_ttl: 30m                     # reuse the same finding for this long
Every field is overridable by env var:
| Env var | Maps to |
|---|---|
AGENT_AI_ENABLE | agent.ai.enable |
AGENT_AI_API_KEY | agent.ai.api_key |
AGENT_AI_MODEL | agent.ai.model |
The chat endpoint is hard-coded to
https://api.openai.com/v1/chat/completions. If you point
AGENT_AI_API_KEY at an OpenAI-compatible provider (Azure
OpenAI, vLLM proxy, etc.), set model to a name your provider
accepts.
You almost always want a small new-service grace so the agent doesn't page on the first signal from a freshly-deployed service:
agent:
  new_service_grace: 30m       # silence brand-new services for this long
  service_patterns:            # how to extract a service from a log line
    - 'service[._]name=([\w.-]+)'
    - '"service"\s*:\s*"([^"]+)"'
    - '^\[([\w.-]+)\]'
See config/config.yaml
for the full set of starter patterns covering Pino, Winston,
Logback, Serilog, zap, slog, syslog, journald, Docker, Envoy,
nginx, and friends.
What gets recorded
Every AI call (and every cache / dry / quota outcome) is
appended to <storage.file.data_dir>/detect.json. The file is a
bounded ring of the most recent 500 events (FIFO); old
entries are evicted automatically.
Each event captures:
- Pattern context — source,
pattern_id, template, service, verdict, frequency, baseline, sample log line. - AI call — model, full user prompt, raw response,
duration. The system prompt is not stored per event — it's
constant per build; fetch it once via
GET /api/agent/ai/system-prompt. - Parsed finding — severity, summary, category, confidence, suggestions.
- Outcome — one of
emitted,cached,dry,quota,ai_error,send_error.
Look at it through the admin UI (the Detect page in the sidebar):

Worked example: end-to-end test
This walks through detect mode end to end on your laptop using the
generate_noisy_logs.py helper. The key trick is the new
--scenario flag, which emits a curated cluster of correlated
failures (e.g. db-outage = db_conn_refused +
db_query_slow + db_deadlock + replication_lag + …), not just
one repeated line. That gives the AI SRE enough context to write a
useful summary.
1. Train the catalog
Start with a clean catalog and a fat baseline of normal traffic so the agent learns what "boring" looks like.
# follow the steps in agent/getting-started.md to start the agent
# in training mode reading from ./logs/my-app.log

python3 scripts/generate_noisy_logs.py \
  --output ./logs/my-app.log \
  --lines 3000 --seed 42
Wait until the per-tick log stops adding new patterns — usually a minute or two for 3000 lines.
2. Switch to detect mode
Update config.yaml (or env vars) and restart the agent:
agent:
  enable: true
  mode: detect
  new_service_grace: 0          # disable grace for the demo
  ai:
    enable: true
    api_key: ${AGENT_AI_API_KEY}
    model: gpt-4o-mini
    max_calls_per_hour: 30
    cache_ttl: 30m
export AGENT_AI_API_KEY=sk-...
docker restart versus-agent
You should see in stdout:
agent: starting worker mode=detect sources=1 ai=enabled model=gpt-4o-mini
3. Inject a curated incident
Pick a scenario:
./scripts/run_noisy_logs.sh --list-scenarios
# auth-attack        auth-login-fail, syslog-sshd, security-breach
# cache-meltdown     redis-timeout, circuit-open, 5xx, worker-lag
# db-outage          db-conn-refused, db-query-slow, db-deadlock, …
# disk-full          disk-full, s3-upload-fail, cron-fail, panic
# k8s-imagepull      k8s-kubelet, pod-restart, k8s-event-json
# oom-cascade        kernel-oom-distinct, oom-killer, pod-restart, …
# tls-expired        certificate-expired, tls-handshake-fail, oncall-fail
Then inject one — say, a database outage — into the file the agent is reading:
./scripts/run_noisy_logs.sh \
  --output ./logs/my-app.log \
  --scenario db-outage \
  --scenario-burst 60
Within one poll interval (default 10s) you should see in the agent's stdout:
agent: tick my-app signals=60 matched=60 patterns=4 \
  verdicts=map[learned:0 spike:3 unknown:1 emit_emitted:2 emit_cached:1]
emit_emitted=2 means two AI calls produced a real incident
(other patterns hit the cache).
4. See what the AI wrote
Open the admin UI at http://localhost:3000 and click
Detect in the sidebar. You'll see the new events at the top.
Click into one to see:
- The full Prompt (system + user) sent to the model.
- The Raw response before JSON parsing.
- The parsed Finding (severity, summary, category, confidence, suggestions).
Or fetch it with curl:
curl -s -H "X-Gateway-Secret: $GATEWAY_SECRET" \
  http://localhost:3000/api/agent/detect | jq '.events[0]'
And the resulting incident lands in the Incidents page (and in Slack / Telegram / wherever you have channels enabled), with the AI's summary, severity, and suggested next steps rendered by each channel's template.
5. Try the other scenarios
Each scenario stresses a different part of the AI's reasoning:
./scripts/run_noisy_logs.sh --scenario tls-expired
./scripts/run_noisy_logs.sh --scenario disk-full
./scripts/run_noisy_logs.sh --scenario oom-cascade
Watch the category and severity fields in the parsed finding
move accordingly.
Cost & safety knobs
max_calls_per_hour— hard cap. With the cache TTL set to 30m and a sane catalog, even a noisy hour rarely calls the model more than ~5–10 times.cache_ttl— samepattern_idre-fires within this window reuses the prior finding for free. Bump it during incident storms; lower it if you want fresher analysis on long-running issues.new_service_grace— silences a brand-new service for the configured duration. The window starts the first time the agent sees the service, and is persisted inpatterns.jsonso it survives restarts.- Rotate the key if it ever appears in a log line you fed the
agent — the redactor scrubs common secret shapes
(
sk-…,xoxb-…, AWS keys, JWTs, basic-auth URLs) but treat it as defense-in-depth, not a guarantee.
Common questions
Q: Can I disable the AI but keep detect mode?
Yes. Set agent.ai.enable: false. The worker classifies
patterns and writes emit_dry outcomes to detect.json so you
can see what would have been analyzed, with no API spend.
Q: How do I stop a noisy pattern from being analyzed?
Mark it as known once and the worker drops it before reaching
the AI step:
curl -X POST -H "X-Gateway-Secret: $GATEWAY_SECRET" \
  -H "Content-Type: application/json" \
  -d '{"verdict":"known"}' \
  http://localhost:3000/api/agent/patterns/<pattern_id>
A spike on a known pattern still triggers (that's the whole
point of spike detection); use cache_ttl to throttle repeats.
Q: My channel template renders Unknown Alert (Unknown) for
AI incidents.
Update to the channel templates shipped with the latest release
— they auto-detect the AI payload via the PatternID field and
render a dedicated "Versus Agent" block.
AI Agent — Spike Detection
Spike detection answers a question that the normal "known/unknown" check cannot: "This error is normal — but why is it happening 50 times a minute instead of the usual 2?"
Once a pattern is labeled known (either automatically after enough
sightings, or by you through the API), the agent stops writing it to
the shadow log. Spike detection brings it back when the volume
suddenly jumps well above the pattern's normal rate.

How it works
The agent keeps a running average for each pattern — specifically an EWMA (Exponentially Weighted Moving Average). Each time the agent polls for new logs, it updates the average with that tick's count, giving more weight to recent ticks and fading out older ones.
Before updating the average the agent takes a snapshot of the
current average and compares the incoming tick count against it. If
the tick count is far above the snapshot, the pattern is flagged as a
spike and written to the shadow log (or forwarded to the AI analyzer
in detect mode), even if it was previously known.
The comparison has three guards:
- The tick must be above a raw minimum — so a baseline of
0.5and a single-match tick doesn't look like a spike. - The pattern must have been seen enough times overall — so the first big burst from a brand-new pattern doesn't get mislabeled before any real average exists.
- The multiplier must be positive — setting it to
0turns the whole feature off.
All three must be true at the same time for a spike to be recorded.
Configuration
These three keys live under agent.catalog in config.yaml:
agent:
  catalog:
    spike_multiplier: 5.0        # how many times above average triggers a spike
    spike_min_frequency: 5       # tick must have at least this many matches
    spike_min_baseline_count: 20 # pattern must have been seen this many times overall
spike_multiplier
Default: 5.0
Think of this as a sensitivity dial. It answers the question: "How much bigger than normal does a burst need to be before I should care?"
If a certain error usually shows up about 2 times every time the
agent checks, and you set this to 5.0, the agent will only flag
it when it suddenly sees more than 5 × 2 = 10 of them in one
check. Anything below that is treated as normal noise.
- Set it higher (e.g.
8.0) if you're getting too many false alarms — only really big jumps will count. - Set it lower (e.g.
3.0) if you want to catch smaller surges earlier. - Set it to
0to turn off spike detection completely.
Examples:
| Normal rate | Multiplier | This check saw | Spike? | Why |
|---|---|---|---|---|
| 2 | 5.0 | 8 | No | 8 is under 10 (5 × 2) |
| 2 | 5.0 | 11 | Yes | 11 is over 10 |
| 2 | 3.0 | 7 | Yes | 7 is over 6 (3 × 2) — lower bar catches it |
| 2 | 0 | 100 | No | Feature is off |
| 1 | 5.0 | 6 | Yes | 6 is over 5 (5 × 1) |
spike_min_frequency
Default: 5
This is a minimum count. Even if the multiplier math says "that's a spike!", the agent will ignore it unless there are at least this many errors in one check.
Why? Imagine an error that almost never happens — say 0.4 times per check on average. If one check happens to have 3 of them, the math says that's 7.5× the normal rate. But 3 errors is probably just a coincidence, not a real problem. This setting stops the agent from overreacting to tiny numbers.
- Set it higher (e.g.
10) if your logs are noisy and you only want to hear about genuinely large bursts. - Set it to
1if you trust the multiplier alone to decide.
Examples:
| Normal rate | Multiplier | Min frequency | This check saw | Spike? | Why |
|---|---|---|---|---|---|
| 0.4 | 5.0 | 5 | 3 | No | 3 errors is under the minimum of 5 |
| 0.4 | 5.0 | 5 | 5 | Yes | 5 meets the minimum, and 5 > 2.0 |
| 1 | 5.0 | 10 | 8 | No | 8 errors is under the minimum of 10 |
| 1 | 5.0 | 10 | 12 | Yes | 12 meets the minimum, and 12 > 5 |
| 0.5 | 5.0 | 1 | 3 | Yes | Minimum is just 1, so the multiplier decides |
spike_min_baseline_count
Default: 20
The agent needs to see an error pattern enough times before it knows what "normal" looks like. This setting says: "Don't even try to detect spikes until you've seen this pattern at least N times total."
Think of it like a new employee. On their first week they have no idea what a busy day looks like. After a few weeks they know the difference between "a little more than usual" and "something is actually wrong". This setting is that learning period.
- Set it higher (e.g.
50) if you want the agent to learn longer before it starts judging. - Set it lower (e.g.
5) if you have low-traffic services where errors take a long time to add up.
Examples:
| Times seen so far | Min baseline count | This check saw | Spike? | Why |
|---|---|---|---|---|
| 3 | 20 | 30 | No | Only seen 3 times — still learning |
| 15 | 20 | 30 | No | Seen 15 times — not enough yet |
| 25 | 20 | 30 | Yes | Seen 25 times — ready to judge |
| 4 | 5 | 30 | No | Seen 4 times — almost ready but not yet |
| 100 | 20 | 30 | Yes | Well past the learning period |
Example
Say the error db-conn-refused normally shows up about 1–2 times
every check. After a few days of training, the agent's average
for this pattern settles at roughly 1.5.
With the default settings, a spike fires when the agent sees
8 or more of them in one check — because 8 > 5.0 (spike_multiplier) × 1.5 (baseline) = 7.5
and 8 ≥ 5 (spike_min_frequency: the minimum count) and the pattern has been seen more
than 20 times (spike_min_baseline_count) overall (so the agent trusts its average).
What the shadow log shows
A spike entry in shadow.json looks like this:
{
  "source": "app-logs",
  "pattern_id": "a3f1c2...",
  "template": "service=db-pool message=\"connection refused to database server <*> port <*>\"",
  "sample": "service=db-pool message=\"connection refused to database server db-07 port 5432\"",
  "rule": "db-errors",
  "verdict": "spike",
  "frequency": 12,
  "timestamp": "2026-05-04T14:23:01Z"
}
Key fields:
verdict: "spike"— tells you this is a volume event, not a new unknown pattern.frequency— how many times the pattern fired in that one tick.template— the learned template for the pattern (with variable parts replaced by<*>).
Read them with:
curl -H "X-Gateway-Secret: $SECRET" \
  http://localhost:3000/api/agent/shadow | jq '.[] | select(.verdict=="spike")'
Or check the aggregate counts:
curl -H "X-Gateway-Secret: $SECRET" \
  http://localhost:3000/api/agent/shadow/stats
Testing spike detection with the log generator
The repo ships a script that generates realistic test logs. It has a
--spike flag designed for this exact workflow.
Step 1 — Build a baseline
Generate enough logs for the agent to train a stable average.
The default is 2000 lines spread over several hours, which is enough
for most patterns to pass spike_min_baseline_count.
python3 scripts/generate_noisy_logs.py \
  --output data/logs/app.log \
  --lines 2000
Point the file source at data/logs/app.log and let the agent run in
training mode until the source is fully consumed. Check
GET /api/agent/status to confirm the catalog is growing.
Step 2 — Switch to shadow mode
docker stop versus-agent
docker run -d \
  --name versus-agent \
  ... \
  -e AGENT_MODE=shadow \
  ghcr.io/versuscontrol/versus-incident:latest
Wait for the agent to catch up. The status endpoint will show
cursor moving forward.
Step 3 — Inject a spike
Append a tight burst of one specific template to the same log file. The agent will read it on the next tick and compare it against the baseline it built in step 1.
# 80 db-conn-refused lines packed into ~16 seconds
python3 scripts/generate_noisy_logs.py \
  --append \
  --start-time now \
  --spike db-conn-refused \
  --spike-burst 80
What --spike does differently from a normal run:
- Ignores
--linesand emits exactly--spike-burstlines. - Uses
--spike-interval-min/--spike-interval-max(default 0.0–0.2 s) instead of the normal 1–5 s spacing so all the lines land in one or two poll ticks. - Optionally emits
--spike-context Nregular noisy lines first so the burst doesn't appear in an empty file.
Step 4 — Check the shadow log
curl -H "X-Gateway-Secret: $SECRET" \
  http://localhost:3000/api/agent/shadow \
  | jq '.[] | select(.verdict=="spike")'
You should see one or more entries with "verdict": "spike" and a
frequency equal to (or close to) your --spike-burst value.
Useful flags
| Flag | Default | What it does |
|---|---|---|
--spike NAME | — | Name of the template to burst. Use --list-templates to see all options. |
--spike-burst N | 50 | Number of lines in the burst. |
--spike-interval-min S | 0.0 | Minimum seconds between burst lines. |
--spike-interval-max S | 0.2 | Maximum seconds between burst lines. |
--spike-context N | 0 | Regular noisy lines to emit before the burst. |
--list-templates | — | Print all template names and exit. |
# See all available template names
python3 scripts/generate_noisy_logs.py --list-templates

# Inject an auto-picked random template
python3 scripts/generate_noisy_logs.py --append --start-time now \
  --spike auto --spike-burst 60

# Add 20 normal lines before the burst so there's some context
python3 scripts/generate_noisy_logs.py --append --start-time now \
  --spike panic --spike-burst 40 --spike-context 20
Tuning tips
- Too many spike alerts? Raise
spike_multiplier(e.g.8.0) orspike_min_frequency(e.g.10). - Missing real surges? Lower
spike_multiplier(e.g.3.0) orspike_min_frequency(e.g.3). - Spikes on new patterns? Raise
spike_min_baseline_countso the agent waits longer before it starts comparing. - Want to disable entirely? Set
spike_multiplier: 0.
AI Agent — Configuration
This page is the reference for every knob the agent exposes. Pair it with Getting Started for a hands-on walkthrough.
The agent reads its configuration from the same config.yaml Versus uses
for the rest of its features. Everything lives under the top-level
agent: key. The list of log sources lives in a sibling file
agent_sources.yaml so it can be managed independently per environment.
Reminder. The agent is off by default (
agent.enable: false). Nothing about the agent runs until that flag flips.
Top-level keys
# Root-level (NOT under agent:)
gateway_secret: ${GATEWAY_SECRET}     # shared secret for ALL admin endpoints
storage:
  type: file                          # file | redis | database
  file:
    data_dir: ./data                  # patterns.json + shadow.json + incidents.json live here
    max_incidents: 1000

agent:
  enable: false
  mode: training
  poll_interval: 30s
  lookback: 5m
  batch_max: 1000
  signal_max_bytes: 8192
  redaction:   { … }
  catalog:     { … }
  miner:       { … }
  regex:       { … }
Important. As of the current release,
gateway_secretand the storage backend live at the root of the config, not underagent:. One secret protects every admin endpoint (/api/admin/*and/api/agent/*); one storage block is shared by the agent's catalog, the shadow log, and the incident history shown in the UI. The agent's previousdata_dirfield has been removed.
| Key | Type | Default | Description |
|---|---|---|---|
enable | bool | false | Master switch. Env: AGENT_ENABLE. |
mode | string | training | One of training | shadow | detect. Env: AGENT_MODE. |
poll_interval | duration | 30s | How often each source is pulled. Lower = more responsive, higher = less load on your log backend. |
lookback | duration | 5m | Initial backfill window on first start (when there's no cursor yet). |
batch_max | int | 1000 | Safety cap on signals processed per tick per source. |
signal_max_bytes | int | 8192 | Truncates a single signal's Raw payload above this size. |
Modes
| Mode | What it does | When to use |
|---|---|---|
training | Observes only. New patterns are added to the catalog; nothing else. | First few days. Until the catalog stabilizes. |
shadow | Same as training, but logs agent[shadow]: would alert … for any signal it would have alerted on. | A release cycle of review before going live. |
detect | Treats unknown / spiking patterns as anomalies, asks the AI SRE to triage them, and emits a real incident through every configured channel. | Production, after you trust the catalog. |
Environment overrides
| Env var | Maps to |
|---|---|
GATEWAY_SECRET | gateway_secret (root) |
STORAGE_TYPE | storage.type |
STORAGE_FILE_DATA_DIR | storage.file.data_dir |
AGENT_ENABLE | agent.enable |
AGENT_MODE | agent.mode |
AGENT_NEW_SERVICE_GRACE | agent.new_service_grace |
AGENT_SERVICE_PATTERNS | agent.service_patterns (comma-separated) |
AGENT_AI_ENABLE | agent.ai.enable |
AGENT_AI_API_KEY | agent.ai.api_key |
AGENT_AI_MODEL | agent.ai.model |
redaction
Pattern-based scrubbing of secrets and PII before any other component sees them. Always enable this in production. See Redaction for the full default rule list and how to extend it.
redaction:
  enable: true
  redact_ips: false
  extra_patterns:
    - "(?i)password=\\S+"
    - "Authorization:\\s*Bearer\\s+\\S+"
| Key | Type | Default | Description |
|---|---|---|---|
enable | bool | true (when agent.enable: true) | Master switch for redaction. |
redact_ips | bool | false | Opt-in IPv4/IPv6 redaction. Off by default because IPs are usually useful context. |
extra_patterns | string list | [] | Additional Go regexes. Invalid patterns are skipped (logged at startup), so one typo can't disable redaction. |
catalog
Long-term storage for learned patterns. See Catalog for the schema and admin workflows.
catalog:
  persist_interval: 30s
  auto_promote_after: 100
| Key | Type | Default | Description |
|---|---|---|---|
persist_interval | duration | 30s | How often the in-memory catalog is flushed to <storage.file.data_dir>/patterns.json. |
auto_promote_after | int | 100 | A pattern seen this many times in detect mode is treated as known (won't alert). 0 disables the promotion. |
The storage backend itself is selected at the root of config.yaml
(storage.type), not here. The on-disk filename is fixed
(patterns.json); the only configurable part is the storage data_dir
(root-level storage.file.data_dir).
miner
Drain-style log clusterer. The defaults work for most setups; tune only
if you see related lines failing to merge into one template (lower
similarity_threshold) or unrelated lines collapsing together (raise
it). See Miner.
miner:
  similarity_threshold: 0.4
  tree_depth: 4
  max_children: 100
| Key | Type | Default | Description |
|---|---|---|---|
similarity_threshold | float (0–1) | 0.4 | Token-overlap ratio required to consider two messages part of the same template. |
tree_depth | int | 4 | Depth of the prefix tree used to bucket templates by length and leading tokens. |
max_children | int | 100 | Per-node fan-out cap to keep the tree bounded. |
regex
Pre-filter and tagger. Only signals whose message matches at least one rule (named or default) are forwarded to the miner — everything else is dropped before clustering. See Regex for cookbook recipes.
regex:
  default_pattern: "(?i).*error.*"
  rules:
    - name: oom-killer
      pattern: "Out of memory: Killed process"
    - name: panic
      pattern: "(?i)panic:"
    - name: 5xx-burst
      pattern: "HTTP/[0-9.]+\\s+5\\d\\d"
| Key | Type | Default | Description |
|---|---|---|---|
default_pattern | regex | "" | Catch-all tried after every named rule misses. Empty = nothing matches by default → strict mode. ".*" = learn from every line. |
rules | list | [] | Named rules. First match wins. Each rule has name and pattern. The matched name is stored on the pattern as rule_name so you can cross-reference shadow events back to the rule that flagged them. |
Common recipes:
| Goal | Setting |
|---|---|
| Learn everything (training, broad scope) | default_pattern: ".*" |
| Only learn explicit rule matches (strict) | default_pattern: "" plus full rules: list |
| Learn only error-ish lines (default) | default_pattern: "(?i).*error.*" |
Signal sources
The list of log sources lives in a sibling file agent_sources.yaml
sitting next to your main config.yaml. The file is optional and,
when present, REPLACES any inline agent.sources from the main
config. Versus expands ${ENV_VAR} references inside the file at
load time.
# config/agent_sources.yaml
sources:
  - name: my-app
    type: file
    enable: true
    file:
      path: /var/log/my-app/app.log
      format: text
      from_beginning: false   # tail-like behavior
Common keys for every source:
| Key | Type | Description |
|---|---|---|
name | string | Unique identifier. Used in cursor keys and admin views. |
type | string | file, elasticsearch, loki, or cloudwatchlogs. |
enable | bool | Per-source switch. |
For per-source field reference and troubleshooting, see the dedicated Data Sources guide:
max_lines_per_pull vs agent.batch_max
These two caps look similar but live at different layers and protect against different things. Both apply on every tick, in this order:
max_lines_per_pull(per-source, file source only). The file source stops reading after this many non-empty lines and persists its byte offset there. Lines past the cap stay in the file and are read on the next tick — nothing is lost.agent.batch_max(worker-wide, every source). After the source returns, the worker truncates the slice tobatch_maxand drops anything beyond it. The source's cursor has already advanced, so dropped signals are gone. This is a backstop for runaway sources, not a normal flow-control knob.
The practical rule: keep max_lines_per_pull ≤ agent.batch_max. If you
flip them around, the worker's hard truncation kicks in and you lose
signals on every tick.
Worked example
Suppose you have a 50,000-line backlog, poll_interval: 30s,
max_lines_per_pull: 1000, and agent.batch_max: 1000:
| Tick | Lines read by file source | After batch_max | Cursor advances by | Remaining backlog |
|---|---|---|---|---|
| 1 | 1,000 | 1,000 | 1,000 | 49,000 |
| 2 | 1,000 | 1,000 | 1,000 | 48,000 |
| … | … | … | … | … |
| 50 | 1,000 | 1,000 | 1,000 | 0 |
Total drain time: 50 ticks × 30s ≈ 25 minutes. Nothing is dropped.
To drain faster, raise max_lines_per_pull and agent.batch_max
together, e.g. both to 5000:
| Tick | Read | After batch_max | Cursor | Remaining |
|---|---|---|---|---|
| 1 | 5,000 | 5,000 | 5,000 | 45,000 |
| … | … | … | … | … |
| 10 | 5,000 | 5,000 | 5,000 | 0 |
Drain time: 10 ticks × 30s ≈ 5 minutes.
What happens if you only raise one of them? With
max_lines_per_pull: 5000 but agent.batch_max: 1000:
| Tick | Read | After batch_max | Cursor | Lost |
|---|---|---|---|---|
| 1 | 5,000 | 1,000 | 5,000 | 4,000 |
| 2 | 5,000 | 1,000 | 5,000 | 4,000 |
The cursor jumps 5,000 lines forward on every tick but only 1,000 are actually mined — the other 4,000 are silently discarded. Always raise the two caps together.
Admin endpoints
All /api/agent/* endpoints require the X-Gateway-Secret header to
match the root-level gateway_secret. With no secret configured the endpoints
are not registered and the agent refuses to start.
| Method | Path | Description |
|---|---|---|
GET | /api/agent/status | Catalog size, dirty flag, persist-interval, mode. |
GET | /api/agent/patterns | All patterns, sorted by sighting count desc. |
GET | /api/agent/patterns/:id | One pattern. |
POST | /api/agent/patterns/:id | Update verdict and/or tags. |
DELETE | /api/agent/patterns/:id | Remove a pattern from the catalog. |
POST | /api/agent/flush | Force-flush the in-memory catalog to disk. |
Example:
curl -H "X-Gateway-Secret: $GATEWAY_SECRET" \
  -H 'Content-Type: application/json' \
  -d '{"verdict":"known","tags":["deploy-rollout","benign"]}' \
  http://localhost:3000/api/agent/patterns/p-abc123
Where to next
- Getting Started — Docker walkthrough.
- Redaction · Regex · Miner · Catalog — component deep-dives.
AI Agent — Data Sources
The AI agent ingests log signals via pluggable sources. Every source implements the same contract — pull new signals since a cursor, return the next cursor — so they can be mixed freely in one deployment.
| Source | Type string | Best for |
|---|---|---|
| File | file | Local files, container stdout via volume, fixtures |
| Elasticsearch | elasticsearch | ELK, Elastic Cloud, OpenSearch |
| Loki | loki | Grafana Loki self-hosted, Grafana Cloud Logs |
| CloudWatch Logs | cloudwatchlogs | AWS Lambda, ECS, EKS, EC2 |
How sources are configured
Sources live in a separate file, agent_sources.yaml, sitting next
to your main config.yaml. The file is optional. When present, it
REPLACES any inline agent.sources from the main config.
# agent_sources.yaml
sources:
  - name: my-source        # unique, used in cursor keys & admin views
    type: file             # one of: file | elasticsearch | loki | cloudwatchlogs
    enable: true
    file:                  # block name MUST match `type`
      path: /var/log/app.log
Multiple sources are supported — each runs on its own goroutine with an independent cursor.
Cursor & ordering
Every source is cursor-based:
Pull(ctx, since)returns signals strictly aftersinceplus the new cursor the worker should pass back next tick.- The worker stores the cursor in Redis under
versus:agent:cursor:<source>(RFC3339Nano timestamp) and falls back to in-memory state when Redis is unavailable. Thefilesource uses a sidecar.cursorfile with the byte offset instead. - On first start (no cursor), the agent backfills
agent.lookbackworth of history (default5m).
This means restarts are safe: the agent picks up exactly where it left off, and no signal is processed twice or skipped.
Try it locally
The runnable docker-compose example
ships with Versus + Redis + Loki + Elasticsearch + Grafana + Kibana
so you can experiment with all source types in a single
docker compose up.
File source
Tail a single log file from disk. The cheapest way to test the agent end-to-end and the source you should use for fixtures or to onboard a new format before plumbing in a real backend.
Minimal config
# agent_sources.yaml
sources:
  - name: my-app
    type: file
    enable: true
    file:
      path: /var/log/my-app/app.log
That's it. The agent tails new lines, parses an optional leading timestamp, and feeds each line through the regex pre-filter and miner.
Full reference
file:
  path: /var/log/my-app/app.log    # REQUIRED. Globs are NOT supported.
  format: text                     # "text" (default) or "json"
  from_beginning: false            # true = replay whole file on first start
  cursor_path: ""                  # default: <storage.file.data_dir>/cursors/file-<name>.cursor
  max_line_bytes: 65536            # truncate longer lines
  max_lines_per_pull: 1000         # cap signals per tick (paginates backlog)

  # text-mode only
  timestamp_layout: ""             # Go time layout; empty = auto-detect

  # json-mode only
  message_field: message
  timestamp_field: "@timestamp"
  severity_field: level
Behavior
- Cursor — A sidecar
<file>.cursorfile (orcursor_path) records the byte offset. Survives restarts and handles log rotation: if the file shrinks, the source reopens from offset 0. - Backlog pagination — When
from_beginning: trueon a large file, the source returns at mostmax_lines_per_pulllines per tick and resumes on the next tick. Nothing is dropped. - Format detection —
format: jsonparses each line as a JSON object and pullsmessage_field/timestamp_field/severity_field. Anything else is treated as plain text.
Tips
- Keep
max_lines_per_pull ≤ agent.batch_max, otherwise the worker's hard truncation drops the overflow on every tick (see Configuration for the worked example). - For Docker / Kubernetes, mount the container's log directory or
/var/lib/docker/containers/<id>/<id>-json.log(withformat: json). - Use it in CI to run agent tests against committed fixtures.
Worked example
Suppose you have from_beginning: true on a 50,000-line file with
poll_interval: 30s, max_lines_per_pull: 1000,
agent.batch_max: 1000:
| Tick | Lines read | Cursor advances | Remaining |
|---|---|---|---|
| 1 | 1,000 | 1,000 | 49,000 |
| … | … | … | … |
| 50 | 1,000 | 1,000 | 0 |
Total drain: 50 × 30s ≈ 25 min, no losses. To go faster, raise
both max_lines_per_pull and agent.batch_max together (e.g. to
5000 → ~5 min). Raising only one drops signals.
Elasticsearch source
Pulls log documents from Elasticsearch / OpenSearch / Elastic Cloud
using the _search API with search_after pagination.
Minimal config
sources:
  - name: prod-app
    type: elasticsearch
    enable: true
    elasticsearch:
      addresses:
        - http://elasticsearch:9200
      index: "logs-app-*"
      time_field: "@timestamp"
      query: '*'
      message_field: message
      page_size: 500
Full reference
elasticsearch:
  addresses:                       # REQUIRED. List of cluster nodes.
    - https://es.prod.example:9200
  username: ${ES_USERNAME}         # HTTP Basic auth
  password: ${ES_PASSWORD}
  api_key: ""                      # alternative to user/pass
  insecure_skip_verify: false      # set true only for dev / self-signed certs

  index: "logs-app-*"              # REQUIRED. Wildcards supported.
  time_field: "@timestamp"         # REQUIRED. Used for sort + range filter.
  query: 'log.level:(error OR warn)'  # Lucene-style; "*" = match all.

  message_field: message           # field copied to Signal.Message
  severity_field: log.level        # optional; copied to Signal.Severity
  extra_fields:                    # extra fields copied to Signal.Fields
    - service.name
    - host.name
    - error.stack_trace

  page_size: 500                   # _search size; capped at 10000
Behavior
- Cursor — Stored as the maximum
time_fieldtimestamp returned on the previous tick. Documents with_source[time_field] <= sinceare filtered out (range: gt). - Pagination — Uses
sort: [{time_field: asc}, {_id: asc}]plussearch_after, so the cursor is stable even when many documents share the same timestamp. - Auth precedence —
api_keywins overusername/passwordwhen both are set.
IAM / role requirements
The user / API key needs read on the configured index pattern.
Minimal Elasticsearch role:
{
  "indices": [
    { "names": ["logs-app-*"], "privileges": ["read", "view_index_metadata"] }
  ]
}
For Elastic Cloud, create an API key under
Stack Management → Security → API keys and pass it via api_key.
Tips
- For very busy indices, always set a
queryfilter (e.g.log.level:(error OR warn)). The miner is fast but ingesting every INFO line of every service is rarely useful. - Pair the agent's
agent.lookback(default5m) withpage_sizeso the first poll completes in one round-trip when possible. - If your time field is in epoch milliseconds, the source converts
numeric values to
time.Unix(0, ms*1e6)automatically.
Try it locally
The docker-compose example
ships an elasticsearch + kibana stack. Send some test logs:
curl -X POST http://localhost:9200/logs-demo/_doc \
  -H 'Content-Type: application/json' \
  -d '{"@timestamp":"2026-05-12T10:00:00Z","message":"db connection refused","level":"error","service":"api"}'
Then enable the sample ES source in agent_sources.yaml and watch
the catalog pick it up at http://localhost:3000/api/agent/patterns.
Troubleshooting
| Symptom | Likely cause |
|---|---|
failed to query elasticsearch: 401 | Wrong creds / API key expired. |
failed to query elasticsearch: 403 | Role missing read on index. |
| Cursor never advances | time_field not present in returned docs, or query matches nothing. |
| Only old data, then silence | time_field doesn't match the field your docs actually use. |
Loki source
Pulls log entries from Grafana Loki
(self-hosted) or Grafana Cloud Logs via the
/loki/api/v1/query_range API.
Minimal config (self-hosted)
sources:
  - name: prod-loki
    type: loki
    enable: true
    loki:
      address: http://loki:3100
      query: '{app="api"} |= "error"'
      page_size: 500
Grafana Cloud
sources:
  - name: gcloud-logs
    type: loki
    enable: true
    loki:
      address: https://logs-prod-006.grafana.net
      username: ${GRAFANA_CLOUD_INSTANCE_ID}     # the numeric instance ID
      password: ${GRAFANA_CLOUD_API_TOKEN}       # API token with `logs:read`
      query: '{namespace="prod"} |~ "(?i)error|panic"'
      severity_field: level
      extra_labels:
        - app
        - namespace
      page_size: 500
Multi-tenant Loki
loki:
  address: http://loki-gateway:3100
  tenant_id: ${LOKI_TENANT_ID}    # sent as X-Scope-OrgID
  bearer_token: ${LOKI_TOKEN}
  query: '{cluster="prod"} |= ""'
Full reference
loki:
  address: http://loki:3100         # REQUIRED. Loki base URL.
  tenant_id: ""                     # X-Scope-OrgID (multi-tenant / Grafana Cloud).

  # Auth — pick at most one. Bearer wins when both are set.
  username: ""
  password: ""
  bearer_token: ""

  insecure_skip_verify: false       # dev only

  query: '{app="api"} |= "error"'   # REQUIRED. LogQL selector + filter.
  severity_field: level             # optional; read from stream LABELS, not log line.
  extra_labels:                     # extra stream labels copied to Signal.Fields.
    - app
    - namespace
  page_size: 500                    # Loki caps around 5000.
Behavior
- Cursor — The maximum log entry timestamp seen on the previous
tick. The next query uses
start = cursor + 1nsbecause Loki'sstartis inclusive — bumping by one nanosecond avoids re-reading the boundary entry. - Direction — Always
direction=forwardso the stream is read oldest-first. - Time range —
start = max(cursor+1ns, now - lookback),end = now. Both as nanosecond Unix timestamps. - Severity — Read from stream labels, not the log line
itself. Make sure your label set includes
level(or whatever you use inseverity_field).
LogQL cheatsheet
| Goal | Query |
|---|---|
| All logs from one app | {app="api"} |
| Errors only | `{app="api"} |
| Case-insensitive regex | `{app="api"} |
| Multiple namespaces | `{namespace=~"prod |
| JSON-extracted field | `{app="api"} |
See the full LogQL reference.
Permissions
- Self-hosted Loki — no built-in RBAC; place Loki behind a
gateway (e.g. nginx) and pass
bearer_token/ Basic auth. - Grafana Cloud — create an Access Policy with the
logs:readscope, then issue a token under that policy.
Try it locally
The docker-compose example
ships a loki + grafana stack. Push a few log lines:
curl -X POST http://localhost:3100/loki/api/v1/push \
  -H 'Content-Type: application/json' \
  -d '{
    "streams":[{
      "stream":{"app":"demo","level":"error"},
      "values":[["'"$(date +%s%N)"'","db connection refused"]]
    }]
  }'
Browse Loki at http://localhost:3000/explore (Grafana) and confirm the agent catalogs the line at http://localhost:3000/api/agent/patterns.
Troubleshooting
| Symptom | Likely cause |
|---|---|
loki: 401 Unauthorized | Wrong instance ID / API token (Grafana Cloud) or missing tenant header. |
loki: 400 parse error | Invalid LogQL — test in Grafana Explore first. |
| No new entries but logs exist | query matches nothing for the current start..end window — try widening agent.lookback. |
| Severity always empty | severity_field reads from stream labels, not the line body — promote the field to a label or extract via \| json \| label_format. |
CloudWatch Logs source
Pulls events from AWS CloudWatch Logs using the FilterLogEvents API.
Cheap, real-time, no async query lifecycle.
Minimal config
sources:
  - name: lambda-prod
    type: cloudwatchlogs
    enable: true
    cloudwatchlogs:
      region: us-east-1
      log_group_name: /aws/lambda/my-function
      page_size: 500
Narrowed query
cloudwatchlogs:
  region: us-east-1
  log_group_name: /aws/ecs/api
  log_stream_prefix: "ecs/api/"          # only recent task streams
  filter_pattern: '?ERROR ?Exception ?panic'
  page_size: 1000
Full reference
cloudwatchlogs:
  region: us-east-1                       # REQUIRED.
  log_group_name: /aws/lambda/my-fn       # REQUIRED. Exact log group name.
  log_stream_prefix: ""                   # restrict to streams starting with this string
  filter_pattern: ""                      # CloudWatch filter syntax — NOT regex
  page_size: 500                          # max 10000
Authentication
The source uses the standard AWS SDK credential chain in this order:
- Environment variables:
AWS_ACCESS_KEY_ID,AWS_SECRET_ACCESS_KEY,AWS_SESSION_TOKEN. - Shared credentials file:
~/.aws/credentials(profile fromAWS_PROFILE, default"default"). - ECS task role (when running in ECS / Fargate).
- EC2 instance profile / EKS IRSA (IAM Roles for Service Accounts).
Required IAM policy:
{
  "Version": "2012-10-17",
  "Statement": [
    {
      "Effect": "Allow",
      "Action": ["logs:FilterLogEvents", "logs:DescribeLogStreams"],
      "Resource": "arn:aws:logs:us-east-1:123456789012:log-group:/aws/lambda/my-function:*"
    }
  ]
}
For multiple log groups, list each Resource ARN — wildcards work
(arn:aws:logs:us-east-1:123456789012:log-group:/aws/lambda/*).
Behavior
-
Cursor — The maximum event timestamp seen on the previous tick. CloudWatch event timestamps are milliseconds since epoch. The next call uses
startTime = cursor + 1msto avoid re-reading the boundary event. -
Pagination — Walks
NextTokenup to 20 pages OR untilpage_sizeevents are collected, whichever happens first. Anything beyond that is read on the next tick. -
Filter pattern syntax — CloudWatch filter syntax, NOT regex:
Pattern Matches ERRORevents containing the word ERROR?ERROR ?Exceptionevents containing ERRORORException"connection refused"exact phrase [time, level=ERROR, ...]space-delimited fields where level == "ERROR"{$.level = "error"}JSON event with level: "error"See the AWS docs for the full grammar.
Cost notes
FilterLogEventsis billed per GB scanned. Always setfilter_patternand/orlog_stream_prefixon chatty groups.page_sizecontrols the per-call cap;agent.poll_intervalcontrols the call rate. A noisy Lambda group withpoll_interval: 30smakes ~120 calls/hour per source.- Use
log_stream_prefixfor ECS/EKS where each task creates a new stream — you don't need to scan retired streams.
Troubleshooting
| Symptom | Likely cause |
|---|---|
AccessDeniedException | IAM policy missing logs:FilterLogEvents for the group ARN. |
ResourceNotFoundException | Wrong log_group_name (case-sensitive) or wrong region. |
ThrottlingException | Lower page_size or raise poll_interval; CloudWatch quotas are per-account-per-region. |
| Empty results despite events in console | filter_pattern is regex-style instead of CloudWatch syntax. |
Local testing without AWS
The integration tests in
pkg/signalsources/cloudwatchlogs_test.go
use httptest + the SDK's BaseEndpoint option to point at a local
mock — useful as a template if you want to wire your own integration
tests.
RedAction
Catalog
Miner
Regex
On Call
This document provides a step-by-step guide to integrating Versus Incident with an on-call solutions. We currently support AWS Incident Manager and PagerDuty, with plans to support more tools in the future.
Before diving into how Versus integrates with on-call systems, let's start with the basics. You need to understand the on-call platforms we support:
Understanding AWS Incident Manager On-Call
Understanding PagerDuty On-Call
Understanding AWS Incident Manager On-Call
Table of Contents
AWS On-Call is a service that helps organizations manage and respond to incidents quickly and effectively. It’s part of AWS Systems Manager. This document explains the key parts of AWS Incident Manager On-Call—contacts, escalation plans, runbooks, and response plans—in a simple and clear way.
Key Components of AWS Incident Manager On-Call
AWS Incident Manager On-Call relies on four main pieces: contacts, escalation plans, runbooks, and response plans. Let’s break them down one by one.

1. Contacts
Contacts are the people who get notified when an incident happens. These could be:
- On-call engineers (the ones on duty to fix things).
- Experts who know specific systems.
- Managers or anyone else who needs to stay in the loop.
Each contact has contact methods—ways to reach them, like:
- SMS (text messages).
- Email.
- Voice calls.
Example: Imagine Natsu is an on-call engineer. His contact info might include:
- SMS: +84 3127 12 567
- Email: natsu@devopsvn.tech
If an incident occurs, AWS Incident Manager can send him a text and an email to let him know she’s needed.
2. Escalation Plans
An escalation plan is a set of rules that decides who gets notified—and in what order—if an incident isn’t handled quickly. It’s like a backup plan to make sure someone responds, even if the first person is unavailable.
You can set it up to:
- Notify people simultaneously (all at once).
- Notify people sequentially (one after another, with a timeout between each).
Example: Suppose you have three engineers: Natsu, Zeref, and Igneel. Your escalation plan might say:
- Stage 1: Notify Natsu.
- Stage 2: If Natsu doesn’t respond in 5 minutes, notify Zeref.
- Stage 3: If Zeref doesn’t respond in another 5 minutes, notify Igneel.
This way, the incident doesn’t get stuck waiting for one person—it keeps moving until someone takes action.
3. Runbooks (Options)
Runbooks are like instruction manuals that AWS can follow automatically to fix an incident. They’re built in AWS Systems Manager Automation and contain steps to solve common problems without needing a human to step in.
Runbooks can:
- Restart a crashed service.
- Add more resources (like extra servers) if something’s overloaded.
- Run checks to figure out what’s wrong.
Example: Let’s say your web server stops working. A runbook called “WebServerRestart” could:
- Automatically detect the issue.
- Restart the server in seconds.
This saves time by fixing the problem before an engineer even picks up their phone.
4. Response Plans
A response plan is the master plan that pulls everything together. It tells AWS Incident Manager:
- Which contacts to notify.
- Which escalation plan to follow.
- Which runbooks to run.
It can have multiple stages, each with its own actions and time limits, to handle an incident step-by-step.
Example: For a critical incident (like a web application going offline), a response plan might look like this:
- 1: Run the “WebServerRestart” runbook and notify Natsu.
- 2: If the issue isn’t fixed in 5 minutes, notify Bob (via the escalation plan).
- 3: If it’s still not resolved in 10 minutes, alert the manager.
This ensures both automation and people work together to fix the problem.
Next, we will provide a step-by-step guide to integrating Versus with AWS Incident Manager for On Call: Integration.
How to Integration AWS Incident Manager On-Call
Table of Contents
- Prerequisites
- Setting Up AWS Incident Manager for On-Call
- Define IAM Role for Versus
- Deploy Versus Incident
- Alert Rules
- Alert Manager Routing Configuration
- Testing the Integration
- Conclusion
This document provides a step-by-step guide to integrate Versus Incident with AWS Incident Manager make an On Call. The integration enables automated escalation of alerts to on-call teams when incidents are not acknowledged within a specified time.
We'll cover configuring Prometheus Alert Manager to send alerts to Versus, setting up AWS Incident Manager, deploying Versus, and testing the integration with a practical example.
Prerequisites
Before you begin, ensure you have:
- An AWS account with access to AWS Incident Manager.
- Versus Incident deployed (instructions provided later).
- Prometheus Alert Manager set up to monitor your systems.
Setting Up AWS Incident Manager for On-Call
AWS Incident Manager requires configuring several components to manage on-call workflows. Let’s configure a practical example using 6 contacts, two teams, and a two-stage response plan. Use the AWS Console to set these up.
Contacts
Contacts are individuals who will be notified during an incident.
- In the AWS Console, navigate to Systems Manager > Incident Manager > Contacts.
- Click Create contact.
- For each contact:
- Enter a Name (e.g., "Natsu Dragneel").
- Add Contact methods (e.g., SMS: +1-555-123-4567, Email: natsu@devopsvn.tech).
- Save the contact.
Repeat to create 6 contacts (e.g., Natsu, Zeref, Igneel, Gray, Gajeel, Laxus).
Escalation Plan
An escalation plan defines the order in which contacts are engaged.
- Go to Incident Manager > Escalation plans > Create escalation plan.
- Name it (e.g., "TeamA_Escalation").
- Add contacts (e.g., Natsu, Zeref, and Igneel) and set them to engage simultaneously or sequentially.
- Save the plan.
- Create a second plan (e.g., "TeamB_Escalation") for Gray, Gajeel, and Laxus.
RunBook (Optional)
RunBooks automate incident resolution steps. For this guide, we’ll skip RunBook creation, but you can define one in AWS Systems Manager Automation if needed.
Response Plan
A response plan ties contacts and escalation plans into a structured response.
- Go to Incident Manager > Response plans > Create response plan.
- Name it (e.g., "CriticalIncidentResponse").
- Choose an Escalation Plan we had created, which defines two stages:
- Stage 1: Engage "TeamA_Escalation" (Natsu, Zeref, and Igneel) with a 5-minute timeout.
- Stage 2: If unacknowledged, engage "TeamB_Escalation" (Gray, Gajeel, and Laxus).
- Save the plan and note its ARN (e.g.,
arn:aws:ssm-incidents::111122223333:response-plan/CriticalIncidentResponse).
Define IAM Role for Versus
Versus needs permissions to interact with AWS Incident Manager.
- In the AWS Console, go to IAM > Roles > Create role.
- Choose AWS service as the trusted entity and select EC2 (or your deployment type, e.g., ECS).
- Attach a custom policy with these permissions:
{
    "Version": "2012-10-17",
    "Statement": [
        {
            "Effect": "Allow",
            "Action": [
                "ssm-incidents:StartIncident",
                "ssm-incidents:GetResponsePlan"
            ],
            "Resource": "*"
        }
    ]
}
- Name the role (e.g., "VersusIncidentRole") and create it.
- Note the Role ARN (e.g.,
arn:aws:iam::111122223333:role/VersusIncidentRole).
Deploy Versus Incident
Deploy Versus using Docker or Kubernetes. Docker Deployment. Create a directory for your configuration files:
mkdir -p ./config
Create config/config.yaml with the following content:
name: versus
host: 0.0.0.0
port: 3000
public_host: https://your-ack-host.example

alert:
  debug_body: true

  slack:
    enable: true
    token: ${SLACK_TOKEN}
    channel_id: ${SLACK_CHANNEL_ID}
    template_path: "config/slack_message.tmpl"
    message_properties:
      button_text: "Acknowledge Alert" # Custom text for the acknowledgment button
      button_style: "primary" # Button style: "primary" (blue), "danger" (red), or empty for default gray
      disable_button: false # Set to true to disable the button if you want to handle acknowledgment differently

oncall:
  enable: true
  wait_minutes: 3

  aws_incident_manager:
    response_plan_arn: ${AWS_INCIDENT_MANAGER_RESPONSE_PLAN_ARN}

redis: # Required for on-call functionality
  insecure_skip_verify: true # dev only
  host: ${REDIS_HOST}
  port: ${REDIS_PORT}
  password: ${REDIS_PASSWORD}
  db: 0
Create Slack templates config/slack_message.tmpl:
🔥 *{{ .commonLabels.severity | upper }} Alert: {{ .commonLabels.alertname }}*

🌐 *Instance*: `{{ .commonLabels.instance }}`
🚨 *Status*: `{{ .status }}`

{{ range .alerts }}
📝 {{ .annotations.description }}
{{ end }}
Slack Acknowledgment Button (Default)
By default, Versus automatically adds an interactive acknowledgment button to Slack notifications when on-call is enabled. This allows users to acknowledge alerts. You can customize the button appearance in your config.yaml, for example:

ACK URL Generation
- When an incident is created (e.g., via a POST to
/api/incidents), Versus generates an acknowledgment URL if on-call is enabled. - The URL is constructed using the
public_hostvalue, typically in the format:https://your-host.example/api/incidents/ack/<incident-id>. - This URL is injected into the button.
Manual Acknowledgment Handling
If you prefer to handle acknowledgments manually or want to disable the default button (by setting disable_button: true), you can add the acknowledgment URL directly in your template. Here's an example of including a clickable link in your Slack template:
🔥 *{{ .commonLabels.severity | upper }} Alert: {{ .commonLabels.alertname }}*

🌐 *Instance*: `{{ .commonLabels.instance }}`
🚨 *Status*: `{{ .status }}`

{{ range .alerts }}
📝 {{ .annotations.description }}
{{ end }}
{{ if .AckURL }}
----------
<{{.AckURL}}|Click here to acknowledge>
{{ end }}
The conditional {{ if .AckURL }} ensures the link only appears if the acknowledgment URL is available (i.e., when on-call is enabled).
Create the docker-compose.yml file:
version: '3.8'

services:
  versus:
    image: ghcr.io/versuscontrol/versus-incident
    ports:
      - "3000:3000"
    environment:
      - SLACK_TOKEN=your_slack_token
      - SLACK_CHANNEL_ID=your_channel_id
      - AWS_INCIDENT_MANAGER_RESPONSE_PLAN_ARN=arn:aws:ssm-incidents::111122223333:response-plan/CriticalIncidentResponse
      - REDIS_HOST=redis
      - REDIS_PORT=6379
      - REDIS_PASSWORD=your_redis_password
    depends_on:
      - redis

  redis:
    image: redis:6.2-alpine
    command: redis-server --requirepass your_redis_password
    ports:
      - "6379:6379"
    volumes:
      - redis_data:/data

volumes:
  redis_data:
Note: If using AWS credentials, add AWS_ACCESS_KEY_ID and AWS_SECRET_ACCESS_KEY environment variables, or attach the IAM role to your deployment environment.
Run Docker Compose:
docker-compose up -d
Alert Rules
Create a prometheus.yml file to define a metric and alerting rule:
global:
scrape_interval: 15s
scrape_configs:
- job_name: 'server'
static_configs:
- targets: ['localhost:9090']
rule_files:
- 'alert_rules.yml'
Create alert_rules.yml to define an alert:
groups:
- name: rate
rules:
- alert: HighErrorRate
expr: rate(http_requests_total{status="500"}[5m]) > 0.1
for: 5m
labels:
severity: warning
annotations:
summary: "High error rate detected in {{ $labels.service }}"
description: "{{ $labels.service }} has an error rate above 0.1 for 5 minutes."
- alert: HighErrorRate
expr: rate(http_requests_total{status="500"}[5m]) > 0.5
for: 2m
labels:
severity: critical
annotations:
summary: "Very high error rate detected in {{ $labels.service }}"
description: "{{ $labels.service }} has an error rate above 0.5 for 2 minutes."
- alert: HighErrorRate
expr: rate(http_requests_total{status="500"}[5m]) > 0.8
for: 1m
labels:
severity: urgent
annotations:
summary: "Extremely high error rate detected in {{ $labels.service }}"
description: "{{ $labels.service }} has an error rate above 0.8 for 1 minute."
Alert Manager Routing Configuration
Configure Alert Manager to route alerts to Versus with different behaviors.
Send Alert Only (No On-Call)
receivers:
- name: 'versus-no-oncall'
webhook_configs:
- url: 'http://versus-service:3000/api/incidents?oncall_enable=false'
send_resolved: false
route:
receiver: 'versus-no-oncall'
group_by: ['alertname', 'service']
routes:
- match:
severity: warning
receiver: 'versus-no-oncall'
Send Alert with Acknowledgment Wait
receivers:
- name: 'versus-with-ack'
webhook_configs:
- url: 'http://versus-service:3000/api/incidents?oncall_wait_minutes=5'
send_resolved: false
route:
routes:
- match:
severity: critical
receiver: 'versus-with-ack'
This waits 5 minutes for acknowledgment before triggering the AWS Incident Manager Response Plan if the user doesn't click the link ACK that Versus sends to Slack.
Send Alert with Immediate On-Call Trigger
receivers:
- name: 'versus-immediate'
webhook_configs:
- url: 'http://versus-service:3000/api/incidents?oncall_wait_minutes=0'
send_resolved: false
route:
routes:
- match:
severity: urgent
receiver: 'versus-immediate'
This triggers the response plan immediately without waiting.
Testing the Integration
- Trigger an Alert: Simulate a critical alert in Prometheus to match the Alert Manager rule.
- Verify Versus: Check that Versus receives the alert and sends it to configured channels (e.g., Slack).
- Check Escalation:
- Wait 5 minutes without acknowledging the alert.
- In Incident Manager > Incidents, verify that an incident starts and Team A is engaged.
- After 5 more minutes, confirm Team B is engaged.
- Immediate Trigger Test: Send an urgent alert and confirm the response plan triggers instantly.
Result

Conclusion
You’ve now integrated Versus Incident with AWS Incident Manager for on-call management! Alerts from Prometheus Alert Manager can trigger notifications via Versus, with escalations handled by AWS Incident Manager based on your response plan. Adjust configurations as needed for your environment.
If you encounter any issues or have further questions, feel free to reach out!
How to Integration AWS Incident Manager On-Call (Advanced)
Table of Contents
- Prerequisites
- Advanced On-Call Management with AWS Incident Manager
- Creating On-Call Schedules
- Understanding AWS Incident Manager Rotations
- Multi-Level Escalation Workflows
- Advanced Versus Incident Configuration
- AWS IAM Role Configuration for Critical-Only Approach
- Advanced Incident Routing Rules
- Dynamic Configuration with Query Parameters
- Monitoring and Analytics
- Testing and Validation
- Testing the Critical-Only Approach
- Conclusion
This document provides an advanced guide to integrating Versus Incident with AWS Incident Manager for advanced on-call management. While the basic integration guide covers essential setup, this advanced guide focuses on implementing complex on-call rotations, schedules, and workflows.
Prerequisites
Before proceeding with this advanced guide, ensure you have:
- Completed the basic AWS Incident Manager integration
- An AWS account with administrative access
- Versus Incident deployed and functioning with basic integrations
- Prometheus Alert Manager configured and sending alerts to Versus
- Multiple teams requiring on-call management with different rotation patterns
Advanced On-Call Management with AWS Incident Manager
AWS Incident Manager offers advanced capabilities for managing on-call schedules, beyond the basic escalation plans covered in the introductory guide. These include:
- On-Call Schedules: Calendar-based rotations of on-call responsibilities
- Rotation Patterns: Daily, weekly, or custom rotation patterns for teams
- Time Zone Management: Support for global teams across different time zones
- Override Capabilities: Handling vacations, sick leave, and special events
Let's configure an advanced on-call system with two teams (Platform and Application) that have different rotation schedules and escalation workflows.
Creating On-Call Schedules
AWS Incident Manager allows you to create on-call schedules that automatically rotate responsibilities among team members. Here's how to set up comprehensive schedules:
-
Create Team-Specific Contact Groups:
- In the AWS Console, navigate to Systems Manager > Incident Manager > Contacts
- Click Create contact group
- For the Platform team:
- Name it "Platform-Team"
- Add 4-6 team member contacts created previously
- Save the group
- Repeat for the Application team
-
Create Schedule Rotations:
- Go to Incident Manager > Schedules
- Click Create schedule
- Configure the Platform team rotation:
- Name: "Platform-Rotation"
- Description: "24/7 support rotation for platform infrastructure"
- Time zone: Select your primary operations time zone
- Rotation settings:
- Rotation pattern: Weekly (Each person is on call for 1 week)
- Start date/time: Choose when the first rotation begins
- Handoff time: Typically 09:00 AM local time
- Recurrence: Recurring every 1 week
- Add all platform engineers to the rotation sequence
- Save the schedule
-
Create Application Team Schedule With Daily Rotation:
- Create another schedule named "App-Rotation"
- Configure for daily rotation instead of weekly
- Set business hours coverage (8 AM - 6 PM)
- Add application team members
- Save the schedule
You now have two separate rotation schedules that will automatically change the primary on-call contact based on the defined patterns.
Understanding AWS Incident Manager Rotations
AWS Incident Manager rotations provide a powerful way to manage on-call responsibilities. Here's a deeper explanation of how they work:
-
Rotation Sequence Management:
- Engineers are added to the rotation in a specific sequence
- Each engineer takes their turn as the primary on-call responder based on the configured rotation pattern
- AWS automatically tracks the current position in the rotation and advances it according to the schedule
-
Shift Transition Process:
- At the configured handoff time (e.g., 9:00 AM), AWS Incident Manager automatically transitions on-call responsibilities
- The system sends notifications to both the outgoing and incoming on-call engineers
- The previous on-call engineer remains responsible until the handoff is complete
- Any incidents created during the handoff window are assigned to the new on-call engineer
-
Handling Availability Exceptions:
- AWS Incident Manager allows you to create Overrides for planned absences like vacations or holidays
- To create an override:
- Navigate to the schedule
- Click "Create override"
- Select the time period and replacement contact
- Save the override
- During the override period, notifications are sent to the replacement contact instead of the regularly scheduled engineer
-
Multiple Rotation Layers:
- You can create primary, secondary, and tertiary rotation schedules
- These can be combined into escalation plans where notification fails over from primary to secondary
- Different rotations can have different time periods (e.g., primary rotates weekly, secondary rotates monthly)
- This adds redundancy to your on-call system and spreads the on-call burden appropriately
-
Managing Time Zones and Global Teams:
- AWS Incident Manager handles time zone differences automatically
- You can configure a "Follow-the-Sun" rotation where engineers in different time zones cover different parts of the day
- The handoff times are adjusted based on the configured time zone of the schedule
-
Rotation Visualization:
- The AWS Console provides a calendar view that shows who is on-call at any given time
- This helps teams plan their schedules and understand upcoming on-call responsibilities
- The calendar view accounts for overrides and exceptions
Multi-Level Escalation Workflows
Build advanced escalation workflows that incorporate your on-call schedules:
-
Create Advanced Escalation Plans:
- Go to Incident Manager > Escalation plans
- Click Create escalation plan
- Name it "Platform-Tiered-Escalation"
- Add escalation stages:
- Stage 1: Current on-call from "Platform-Rotation" (wait 5 minutes)
- Stage 2: Secondary on-call + Team Lead (wait 5 minutes)
- Stage 3: Engineering Manager + Director (wait 10 minutes)
- Stage 4: CTO/VP Engineering
-
Configure Severity-Based Escalation: Create an escalation plan specifically for critical alerts:
- Critical: Immediate engagement of primary on-call, with fast escalation (2-minute acknowledgment)
- Note: Non-critical alerts don't trigger on-call processes
-
Create Enhanced Response Plans:
- Go to Incident Manager > Response plans
- Create separate response plans aligned with different services and severity levels
- For example, "Critical-Platform-Outage" with:
- Associated escalation plan: "Platform-Tiered-Escalation"
- Automatic engagement of specific chat channels
- Pre-defined runbooks for common failure scenarios
- Integration with status page updates
These advanced escalation workflows ensure that the right people are engaged at the right time, without unnecessary escalation for routine issues.
Advanced Versus Incident Configuration
Configure Versus Incident for advanced integration with AWS Incident Manager:
name: versus
host: 0.0.0.0
port: 3000
public_host: https://versus.example.com # Required for acknowledgment URLs
alert:
debug_body: true # Useful for troubleshooting
slack:
enable: true
token: ${SLACK_TOKEN}
channel_id: ${SLACK_CHANNEL_ID}
template_path: "config/slack_message.tmpl"
message_properties:
button_text: "Acknowledge Incident"
button_style: "primary"
disable_button: false
oncall:
initialized_only: true # Initialize on-call but keep it disabled by default
enable: false # Not needed when initialized_only is true
wait_minutes: 2 # Wait 2 minutes before escalating critical alerts
provider: aws_incident_manager # Specify AWS Incident Manager as the on-call provider
# AWS Incident Manager response plan for critical alerts only
aws_incident_manager:
response_plan_arn: "arn:aws:ssm-incidents::123456789012:response-plan/PlatformCriticalPlan"
# Optional: Configure multiple response plans for different environments or teams
other_response_plan_arns:
app: "arn:aws:ssm-incidents::123456789012:response-plan/AppCriticalPlan"
redis: # Required for on-call functionality
insecure_skip_verify: false # production setting
host: ${REDIS_HOST}
port: ${REDIS_PORT}
password: ${REDIS_PASSWORD}
db: 0
This configuration allows Versus to:
- Use AWS response plans for critical alerts only
- Set a 2-minute wait time before escalation for critical alerts
- Ensure non-critical alerts don't trigger on-call processes
Understanding the initialized_only Setting
The initialized_only: true setting is a powerful feature that allows you to:
-
Initialize the on-call system but keep it disabled by default: The on-call infrastructure is set up and ready to use, but won't automatically trigger for any alerts.
-
Enable on-call selectively using query parameters: Only alerts that explicitly include
?oncall_enable=truein their webhook URL will trigger the on-call workflow. -
Implement a critical-only approach: Combined with Alert Manager routing rules, you can ensure only critical alerts with the right query parameters trigger on-call.
This approach provides several advantages:
- Greater control over which alerts can page on-call engineers
- Ability to test the on-call system without changing configuration
- Flexibility to adjust which services can trigger on-call without redeploying
- Protection against accidental on-call notifications during configuration changes
Enhanced Slack Template
Create an enhanced Slack template (config/slack_message.tmpl) that provides more context:
🔥 *{{ .commonLabels.severity | upper }} Alert: {{ .commonLabels.alertname }}*
🌐 *System*: `{{ .commonLabels.system }}`
🖥️ *Instance*: `{{ .commonLabels.instance }}`
🚨 *Status*: `{{ .status }}`
⏱️ *Detected*: `{{ .startsAt | date "Jan 02, 2006 15:04:05 MST" }}`
{{ range .alerts }}
📝 *Description*: {{ .annotations.description }}
{{ if .annotations.runbook }}📚 *Runbook*: {{ .annotations.runbook }}{{ end }}
{{ if .annotations.dashboard }}📊 *Dashboard*: {{ .annotations.dashboard }}{{ end }}
{{ end }}
{{ if .AckURL }}
⚠️ *Auto-escalation*: This alert will escalate {{ if eq .commonLabels.severity "critical" }}in 2 minutes{{ end }} if not acknowledged.
{{ end }}
This template provides additional context and clear timing expectations for responders.
AWS IAM Role Configuration for Critical-Only Approach
For the critical-only on-call approach, you need to configure appropriate IAM permissions. This role allows Versus Incident to interact with AWS Incident Manager but only for critical incidents:
- Create a Dedicated IAM Policy:
{
"Version": "2012-10-17",
"Statement": [
{
"Effect": "Allow",
"Action": [
"ssm-incidents:StartIncident",
"ssm-incidents:GetResponsePlan",
"ssm-incidents:ListResponsePlans",
"ssm-incidents:TagResource"
],
"Resource": [
"arn:aws:ssm-incidents:*:*:response-plan/*Critical*",
"arn:aws:ssm-incidents:*:*:incident/*"
]
},
{
"Effect": "Allow",
"Action": [
"ssm-contacts:GetContact",
"ssm-contacts:ListContacts"
],
"Resource": "*"
}
]
}
This policy:
- Restricts incident creation to response plans containing "Critical" in the name
- Provides access to contacts for notification purposes
- Allows tagging of incidents for better organization
-
Create an IAM Role:
- Create a new role with the appropriate trust relationship for your deployment environment (EC2, ECS, or Lambda)
- Attach the policy created above
- Note the Role ARN (e.g.,
arn:aws:iam::111122223333:role/VersusIncidentCriticalRole)
-
Configure AWS Credentials:
- If using environment variables, set
AWS_ACCESS_KEY_IDandAWS_SECRET_ACCESS_KEYfrom a user with the ability to assume this role - Alternatively, use EC2 instance profiles or AWS service roles for containerized deployments
- If using environment variables, set
This IAM configuration ensures that even if a non-critical incident tries to invoke the response plan, it will fail due to IAM permissions, providing an additional layer of enforcement for your critical-only on-call policy.
Advanced Incident Routing Rules
Configure Alert Manager with advanced routing based on services, teams, and severity to work with the initialized_only setting:
receivers:
- name: 'versus-normal'
webhook_configs:
- url: 'http://versus-service:3000/api/incidents'
send_resolved: true
- name: 'versus-critical'
webhook_configs:
- url: 'http://versus-service:3000/api/incidents?oncall_enable=true'
send_resolved: true
- name: 'versus-app-normal'
webhook_configs:
- url: 'http://versus-service:3000/api/incidents'
send_resolved: true
- name: 'versus-app-critical'
webhook_configs:
- url: 'http://versus-service:3000/api/incidents?oncall_enable=true&awsim_other_response_plan=app'
send_resolved: true
- name: 'versus-business-hours'
webhook_configs:
- url: 'http://versus-service:3000/api/incidents'
send_resolved: true
route:
receiver: 'versus-normal' # Default receiver
group_by: ['alertname', 'service', 'severity']
# Time-based routing
routes:
- match_re:
timeperiod: "business-hours"
receiver: 'versus-business-hours'
# Team and severity based routing - on-call only for critical
- match:
team: platform
severity: critical
receiver: 'versus-critical'
- match:
team: platform
severity: high
receiver: 'versus-normal'
- match:
team: application
severity: critical
receiver: 'versus-app-critical'
- match:
team: application
severity: high
receiver: 'versus-app-normal'
This configuration ensures that:
- On-call is completely disabled by default (even for critical alerts)
- Only alerts explicitly configured to trigger on-call will do so
- You have granular control over which alerts and severity levels can page your team
- You can easily test alert routing without risk of accidental paging
Dynamic Configuration with Query Parameters
Versus Incident supports dynamic configuration through query parameters, which is especially powerful for managing on-call behavior when using initialized_only: true. These parameters can be added to your Alert Manager webhook URLs to override default settings on a per-alert basis:
| Query Parameter | Description | Example |
|---|---|---|
oncall_enable | Enable or disable on-call for a specific alert | ?oncall_enable=true |
oncall_wait_minutes | Override the default wait time before escalation | ?oncall_wait_minutes=5 |
awsim_other_response_plan | Use an alternative response plan defined in your configuration | ?awsim_other_response_plan=app |
Example Alert Manager Configurations:
# Immediately trigger on-call for database failures (no wait)
- name: 'versus-db-critical'
webhook_configs:
- url: 'http://versus-service:3000/api/incidents?oncall_enable=true&oncall_wait_minutes=0'
send_resolved: true
# Use a custom response plan for network issues
- name: 'versus-network-critical'
webhook_configs:
- url: 'http://versus-service:3000/api/incidents?oncall_enable=true&awsim_other_response_plan=network'
send_resolved: true
This flexibility allows you to fine-tune your incident response workflow based on the specific needs of different services and alert types while maintaining the critical-only approach to on-call escalation.
Monitoring and Analytics
Implement metrics and reporting for your incident response process:
-
Create CloudWatch Dashboards:
- Track incident frequency by service
- Monitor Mean Time to Acknowledge (MTTA)
- Monitor Mean Time to Resolve (MTTR)
- Track escalation frequency
- Visualize on-call burden distribution
-
Set Up Regular Reporting:
- Configure automatic weekly reports of on-call activity
- Track key metrics over time:
- Number of incidents by severity
- Acknowledge time by team, rotation, and individual
- Resolution time
- False positive rate
-
Implement Continuous Improvement:
- Review metrics regularly with teams
- Identify top sources of incidents
- Track improvement initiatives
- Use AWS Incident Manager's post-incident analysis feature
These analytics help identify patterns, reduce false positives, and enable teams to address systemic issues.
Testing and Validation
Thoroughly test your advanced on-call workflows:
-
Schedule Test Scenarios:
- During handoff periods between rotations
- At different times of day
- With different alert severities
- During planned override periods
-
Document Results:
- Track actual response times
- Identify any notification failures
- Ensure ChatBot integration works correctly
- Validate metrics collection
-
Conduct Regular Fire Drills:
- Schedule monthly unannounced test incidents
- Rotate scenarios to test different aspects of the system
- Include post-drill reviews and improvement plans
Testing the Critical-Only Approach
You need to verify both that on-call is triggered with the right parameters and that it doesn't trigger by default:
-
Test Default Behavior (Should NOT Trigger On-Call):
# Send a critical alert WITHOUT oncall_enable parameter - should NOT trigger on-call curl -X POST "http://versus-service:3000/api/incidents" \ -H "Content-Type: application/json" \ -d '{ "Logs": "[CRITICAL] This is a critical alert that should not trigger on-call", "ServiceName": "test-service", "Severity": "critical" }'Verify that:
- The alert appears in your notification channels (Slack, etc.)
- No AWS Incident Manager incident is created
- No on-call team is notified
-
Test Explicit On-Call Activation:
# Send a critical alert WITH oncall_enable=true - should trigger on-call after wait period curl -X POST "http://versus-service:3000/api/incidents?oncall_enable=true" \ -H "Content-Type: application/json" \ -d '{ "Logs": "[CRITICAL] This is a critical alert that SHOULD trigger on-call", "ServiceName": "test-service", "Severity": "critical" }'Verify that:
- The alert appears in your notification channels with an acknowledgment button
- If not acknowledged within the wait period, an AWS Incident Manager incident is created
- The appropriate on-call team is notified
-
Test Immediate On-Call Activation:
# Send a critical alert with immediate on-call activation curl -X POST "http://versus-service:3000/api/incidents?oncall_enable=true&oncall_wait_minutes=0" \ -H "Content-Type: application/json" \ -d '{ "Logs": "[CRITICAL] This is a critical alert that should trigger on-call IMMEDIATELY", "ServiceName": "test-service", "Severity": "critical" }'Verify that:
- An AWS Incident Manager incident is created immediately
- The on-call team is notified without waiting for acknowledgment
-
Test Response Plan Override:
# Use a specific response plan curl -X POST "http://versus-service:3000/api/incidents?oncall_enable=true&awsim_other_response_plan=platform" \ -H "Content-Type: application/json" \ -d '{ "Logs": "[CRITICAL] Platform issue requiring specific team", "ServiceName": "platform-service", "Severity": "critical" }'Verify that:
- The correct response plan is used (check in AWS Incident Manager)
- The appropriate platform team is engaged
Conclusion
By implementing this advanced on-call management system with AWS Incident Manager and Versus Incident, you've created a advanced incident response workflow that:
- Automatically rotates on-call responsibilities among team members
- Only triggers on-call for critical alerts with explicit activation, preventing alert fatigue
- Routes incidents to the appropriate teams based on service and time
- Escalates critical incidents according to well-defined patterns
- Facilitates real-time collaboration during incidents
- Provides analytics for continuous improvement
This system ensures that critical incidents receive appropriate attention without unnecessary escalation for routine issues. For non-critical alerts, they're still visible in notification channels, but don't trigger the on-call escalation process.
Regularly review and refine your configurations as your organization and systems evolve. Solicit feedback from on-call engineers to identify pain points and improvement opportunities. Consider gathering metrics on the effectiveness of your approach, adjusting severity thresholds and query parameters as needed.
If you encounter any challenges or have questions about advanced configurations, refer to the AWS Incident Manager documentation or reach out to the Versus Incident community for support.
Understanding PagerDuty On-Call
Table of Contents
- Key Components of PagerDuty On-Call
- 1. Services
- 2. Escalation Policies
- 3. Schedules
- 4. Integrations
- The PagerDuty Incident Lifecycle
- Key Benefits of PagerDuty for On-Call Management
PagerDuty is a popular incident management platform that provides robust on-call scheduling, alerting, and escalation capabilities. This document explains the key components of PagerDuty's on-call system—services, escalation policies, schedules, and integrations—in a simple and clear way.
Key Components of PagerDuty On-Call
PagerDuty's on-call system relies on four main components: services, escalation policies, schedules, and integrations. Let's explore each one in detail.
1. Services
Services in PagerDuty represent the applications, components, or systems that you monitor. Each service:
- Has a unique name and description
- Is associated with an escalation policy
- Can be integrated with monitoring tools
- Contains a set of alert/incident settings
When an incident is triggered, it's associated with a specific service, which determines how the incident is handled and who is notified.
Example: A "Payment Processing API" service might be set up to:
- Alert the backend team when it experiences errors
- Have high urgency for all incidents
- Auto-resolve incidents after 24 hours if fixed
2. Escalation Policies
Escalation policies define who gets notified about an incident and in what order. They ensure that incidents are addressed even if the first responder isn't available.
An escalation policy typically includes:
- One or more escalation levels with designated responders
- Time delays between escalation levels
- Options to repeat the escalation process if no one responds
Example: For the "Payment API" service, an escalation policy might:
- Level 1: Notify the on-call engineer on the primary schedule
- Level 2: If no response in 15 minutes, notify the secondary on-call engineer
- Level 3: If still no response in 10 minutes, notify the engineering manager
3. Schedules
Schedules determine who is on-call at any given time. They allow teams to:
- Define rotation patterns (daily, weekly, custom)
- Set up multiple layers of coverage
- Handle time zone differences
- Plan for holidays and time off
PagerDuty's schedules are highly flexible and can accommodate complex team structures and rotation patterns.
Example: A "Backend Team Primary" schedule might rotate three engineers weekly, with handoffs occurring every Monday at 9 AM local time. A separate "Backend Team Secondary" schedule might rotate a different group of engineers as backup.
4. Integrations
Integrations connect PagerDuty to your monitoring tools, allowing alerts to be automatically converted into PagerDuty incidents. PagerDuty offers hundreds of integrations with popular monitoring systems.
For custom systems or tools without direct integrations, PagerDuty provides:
- Events API (V2) - A simple API for sending alerts to PagerDuty
- Webhooks - For receiving data about PagerDuty incidents in your other systems
Example: A company might integrate:
- Prometheus Alert Manager with their "Infrastructure" service
- Application error tracking with their "Application Errors" service
- Custom business logic monitors with their "Business Metrics" service
The PagerDuty Incident Lifecycle
When an incident is created in PagerDuty:
- Trigger: An alert comes in from an integrated monitoring system or API call
- Notification: PagerDuty notifies the appropriate on-call person based on the escalation policy
- Acknowledgment: The responder acknowledges the incident, letting others know they're working on it
- Resolution: After fixing the issue, the responder resolves the incident
- Post-Mortem: Teams can analyze what happened and how to prevent similar issues
This structured approach ensures that incidents are handled efficiently and consistently.
Key Benefits of PagerDuty for On-Call Management
- Reliability: Ensures critical alerts never go unnoticed with multiple notification methods and escalation paths
- Flexibility: Supports complex team structures and rotation patterns
- Reduced Alert Fatigue: Intelligent grouping and routing of alerts to the right people
- Comprehensive Visibility: Dashboards and reports to track incident metrics and on-call load
- Integration Ecosystem: Works with virtually any monitoring or alerting system
Next, we will provide a step-by-step guide to integrating Versus with PagerDuty for On-Call: Integration.
How to Integrate with PagerDuty
Table of Contents
- Prerequisites
- Setting Up PagerDuty for On-Call
- Deploy Versus Incident
- Alert Manager Routing Configuration
- Override the PagerDuty Routing Key per Alert
- Testing the Integration
- How It Works Under the Hood
- Conclusion
This document provides a step-by-step guide to integrate Versus Incident with PagerDuty for on-call management. The integration enables automated escalation of alerts to on-call teams when incidents are not acknowledged within a specified time.
We'll cover setting up PagerDuty, configuring the integration with Versus, deploying Versus, and testing the integration with practical examples.
Prerequisites
Before you begin, ensure you have:
- A PagerDuty account (you can start with a free trial if needed)
- Versus Incident deployed (instructions provided later)
- Prometheus Alert Manager set up to monitor your systems
Setting Up PagerDuty for On-Call
Let's configure a practical example in PagerDuty with services, schedules, and escalation policies.
1. Create Users in PagerDuty
First, we need to set up the users who will be part of the on-call rotation:
- Log in to your PagerDuty account
- Navigate to People > Users > Add User
- For each user, enter:
- Name (e.g., "Natsu Dragneel")
- Email address
- Role (User)
- Time Zone
- PagerDuty will send an email invitation to each user
- Users should complete their profiles by:
- Setting up notification rules (SMS, email, push notifications)
- Downloading the PagerDuty mobile app
- Setting contact details
Repeat to create multiple users (e.g., Natsu, Zeref, Igneel, Gray, Gajeel, Laxus).
2. Create On-Call Schedules
Now, let's create schedules for who is on-call and when:
- Navigate to People > Schedules > Create Schedule
- Name the schedule (e.g., "Team A Primary")
- Set up the rotation:
- Choose a rotation type (Weekly is common)
- Add users to the rotation (e.g., Natsu, Zeref, Igneel)
- Set handoff time (e.g., Mondays at 9:00 AM)
- Set time zone
- Save the schedule
- Create a second schedule (e.g., "Team B Secondary") for other team members
3. Create Escalation Policies
An escalation policy defines who gets notified when an incident occurs:
- Navigate to Configuration > Escalation Policies > New Escalation Policy
- Name the policy (e.g., "Critical Incident Response")
- Add escalation rules:
- Level 1: Select the "Team A Primary" schedule with a 5-minute timeout
- Level 2: Select the "Team B Secondary" schedule
- Optionally, add a Level 3 to notify a manager
- Save the policy
4. Create a PagerDuty Service
A service is what receives incidents from monitoring systems:
- Navigate to Configuration > Services > New Service
- Name the service (e.g., "Versus Incident Integration")
- Select "Events API V2" as the integration type
- Select the escalation policy you created in step 3
- Configure incident settings (Auto-resolve, urgency, etc.)
- Save the service
5. Get the Integration Key
After creating the service, you'll need the integration key (also called routing key):
- Navigate to Configuration > Services
- Click on your newly created service
- Go to the Integrations tab
- Find the "Events API V2" integration
- Copy the Integration Key (it looks something like:
12345678abcdef0123456789abcdef0) - Keep this key secure - you'll need it for Versus configuration
Deploy Versus Incident
Now let's deploy Versus with PagerDuty integration. You can use Docker or Kubernetes.
Docker Deployment
Create a directory for your configuration files:
mkdir -p ./config
Create config/config.yaml with the following content:
name: versus
host: 0.0.0.0
port: 3000
public_host: https://your-ack-host.example
alert:
debug_body: true
slack:
enable: true
token: ${SLACK_TOKEN}
channel_id: ${SLACK_CHANNEL_ID}
template_path: "config/slack_message.tmpl"
oncall:
enable: true
wait_minutes: 3
provider: pagerduty
pagerduty:
routing_key: ${PAGERDUTY_ROUTING_KEY} # The Integration Key from step 5
other_routing_keys:
infra: ${PAGERDUTY_OTHER_ROUTING_KEY_INFRA}
app: ${PAGERDUTY_OTHER_ROUTING_KEY_APP}
db: ${PAGERDUTY_OTHER_ROUTING_KEY_DB}
redis: # Required for on-call functionality
insecure_skip_verify: true # dev only
host: ${REDIS_HOST}
port: ${REDIS_PORT}
password: ${REDIS_PASSWORD}
db: 0
Create a Slack template in config/slack_message.tmpl:
🔥 *{{ .commonLabels.severity | upper }} Alert: {{ .commonLabels.alertname }}*
🌐 *Instance*: `{{ .commonLabels.instance }}`
🚨 *Status*: `{{ .status }}`
{{ range .alerts }}
📝 {{ .annotations.description }}
{{ end }}
Slack Acknowledgment Button (Default)
By default, Versus automatically adds an interactive acknowledgment button to Slack notifications when on-call is enabled. This allows users to acknowledge alerts. You can customize the button appearance in your config.yaml, for example:
ACK URL Generation
- When an incident is created (e.g., via a POST to
/api/incidents), Versus generates an acknowledgment URL if on-call is enabled. - The URL is constructed using the
public_hostvalue, typically in the format:https://your-host.example/api/incidents/ack/<incident-id>. - This URL is injected into the button.
Manual Acknowledgment Handling
If you prefer to handle acknowledgments manually or want to disable the default button (by setting disable_button: true), you can add the acknowledgment URL directly in your template. Here's an example of including a clickable link in your Slack template:
🔥 *{{ .commonLabels.severity | upper }} Alert: {{ .commonLabels.alertname }}*
🌐 *Instance*: `{{ .commonLabels.instance }}`
🚨 *Status*: `{{ .status }}`
{{ range .alerts }}
📝 {{ .annotations.description }}
{{ end }}
{{ if .AckURL }}
----------
<{{.AckURL}}|Click here to acknowledge>
{{ end }}
The conditional {{ if .AckURL }} ensures the link only appears if the acknowledgment URL is available (i.e., when on-call is enabled).
Create the docker-compose.yml file:
version: '3.8'
services:
versus:
image: ghcr.io/versuscontrol/versus-incident
ports:
- "3000:3000"
environment:
- SLACK_TOKEN=your_slack_token
- SLACK_CHANNEL_ID=your_channel_id
- PAGERDUTY_ROUTING_KEY=your_pagerduty_integration_key
- REDIS_HOST=redis
- REDIS_PORT=6379
- REDIS_PASSWORD=your_redis_password
depends_on:
- redis
redis:
image: redis:6.2-alpine
command: redis-server --requirepass your_redis_password
ports:
- "6379:6379"
volumes:
- redis_data:/data
volumes:
redis_data:
Run Docker Compose:
docker-compose up -d
Alert Manager Routing Configuration
Now, let's configure Alert Manager to route alerts to Versus with different behaviors:
Send Alert Only (No On-Call)
receivers:
- name: 'versus-no-oncall'
webhook_configs:
- url: 'http://versus-service:3000/api/incidents?oncall_enable=false'
send_resolved: false
route:
receiver: 'versus-no-oncall'
group_by: ['alertname', 'service']
routes:
- match:
severity: warning
receiver: 'versus-no-oncall'
Send Alert with Acknowledgment Wait
receivers:
- name: 'versus-with-ack'
webhook_configs:
- url: 'http://versus-service:3000/api/incidents?oncall_wait_minutes=5'
send_resolved: false
route:
routes:
- match:
severity: critical
receiver: 'versus-with-ack'
This configuration waits 5 minutes for acknowledgment before triggering PagerDuty if the user doesn't click the ACK link in Slack.
Send Alert with Immediate On-Call Trigger
receivers:
- name: 'versus-immediate'
webhook_configs:
- url: 'http://versus-service:3000/api/incidents?oncall_wait_minutes=0'
send_resolved: false
route:
routes:
- match:
severity: urgent
receiver: 'versus-immediate'
This will trigger PagerDuty immediately without waiting.
Override the PagerDuty Routing Key per Alert
You can configure Alert Manager to use different PagerDuty services for specific alerts by using named routing keys instead of exposing sensitive routing keys directly in URLs:
receivers:
- name: 'versus-pagerduty-infra'
webhook_configs:
- url: 'http://versus-service:3000/api/incidents?pagerduty_other_routing_key=infra'
send_resolved: false
route:
routes:
- match:
team: infrastructure
receiver: 'versus-pagerduty-infra'
This routes infrastructure team alerts to a different PagerDuty service using the named routing key "infra", which is securely mapped to the actual integration key in your configuration file:
oncall:
provider: pagerduty
pagerduty:
routing_key: ${PAGERDUTY_ROUTING_KEY}
other_routing_keys:
infra: ${PAGERDUTY_OTHER_ROUTING_KEY_INFRA}
app: ${PAGERDUTY_OTHER_ROUTING_KEY_APP}
db: ${PAGERDUTY_OTHER_ROUTING_KEY_DB}
This approach keeps your sensitive PagerDuty integration keys secure by never exposing them in URLs or logs.
Testing the Integration
Let's test the complete workflow:
-
Trigger an Alert:
- Simulate a critical alert in Prometheus to match the Alert Manager rule.
-
Verify Versus:
- Check that Versus receives the alert and sends it to Slack.
- You should see a message with an acknowledgment link.
-
Check Escalation:
- Option 1: Click the ACK link to acknowledge the incident - PagerDuty should not be notified.
- Option 2: Wait for the acknowledgment timeout (e.g., 5 minutes) without clicking the link.
- In PagerDuty, verify that an incident is created and the on-call person is notified.
- Confirm that escalation happens according to your policy if the incident remains unacknowledged.
-
Immediate Trigger Test:
- Send an urgent alert and confirm that PagerDuty is triggered instantly.
How It Works Under the Hood
When Versus integrates with PagerDuty, the following occurs:
- Versus receives an alert from Alert Manager
- If on-call is enabled and the acknowledgment period passes without an ACK, Versus:
- Constructs a PagerDuty Events API v2 payload
- Sends a "trigger" event to PagerDuty with your routing key
- Includes incident details as custom properties
The PagerDuty service processes this event according to your escalation policy, notifying the appropriate on-call personnel.
Conclusion
You've now integrated Versus Incident with PagerDuty for on-call management! Alerts from Prometheus Alert Manager can trigger notifications via Versus, with escalations handled by PagerDuty based on your escalation policy.
This integration provides:
- A delay period for engineers to acknowledge incidents before escalation
- Slack notifications with one-click acknowledgment
- Structured escalation through PagerDuty's robust notification system
- Multiple notification channels to ensure critical alerts reach the right people
Adjust configurations as needed for your environment and incident response processes. If you encounter any issues or have further questions, feel free to reach out!
Migrating to v1.2.0
Table of Contents
- What's New in v1.2.0
- Key Changes
- Configuration Changes
- Migration Steps
- Testing the Migration
- Additional Notes
This guide provides instructions for migrating from v1.1.5 to v1.2.0.
What's New in v1.2.0
Version 1.2.0 introduces enhanced Microsoft Teams integration using Power Automate, allowing you to send incident alerts directly to Microsoft Teams channels with more formatting options and better delivery reliability.
Key Changes
The main change in v1.2.0 is the Microsoft Teams integration architecture:
-
Legacy webhook URLs replaced with Power Automate: Instead of using the legacy Office 365 webhook URLs, Versus Incident now integrates with Microsoft Teams through Power Automate HTTP triggers, which provide more flexibility and reliability.
-
Configuration property names updated:
webhook_url→power_automate_urlother_webhook_url→other_power_urls
-
Environment variable names updated:
MSTEAMS_WEBHOOK_URL→MSTEAMS_POWER_AUTOMATE_URLMSTEAMS_OTHER_WEBHOOK_URL_*→MSTEAMS_OTHER_POWER_URL_*
-
API query parameter updated:
msteams_other_webhook_url→msteams_other_power_url
Configuration Changes
Here's a side-by-side comparison of the Microsoft Teams configuration in v1.1.5 vs v1.2.0:
v1.1.5 (Before)
alert:
# ... other alert configurations ...
msteams:
enable: false # Default value, will be overridden by MSTEAMS_ENABLE env var
webhook_url: ${MSTEAMS_WEBHOOK_URL}
template_path: "config/msteams_message.tmpl"
other_webhook_url: # Optional: Define additional webhook URLs
qc: ${MSTEAMS_OTHER_WEBHOOK_URL_QC}
ops: ${MSTEAMS_OTHER_WEBHOOK_URL_OPS}
dev: ${MSTEAMS_OTHER_WEBHOOK_URL_DEV}
v1.2.0 (After)
alert:
# ... other alert configurations ...
msteams:
enable: false # Default value, will be overridden by MSTEAMS_ENABLE env var
power_automate_url: ${MSTEAMS_POWER_AUTOMATE_URL} # Power Automate HTTP trigger URL
template_path: "config/msteams_message.tmpl"
other_power_urls: # Optional: Enable overriding the default Power Automate flow
qc: ${MSTEAMS_OTHER_POWER_URL_QC}
ops: ${MSTEAMS_OTHER_POWER_URL_OPS}
dev: ${MSTEAMS_OTHER_POWER_URL_DEV}
Migration Steps
1. Update Your Configuration File
Replace the Microsoft Teams section in your config.yaml file:
msteams:
enable: false # Set to true to enable, or use MSTEAMS_ENABLE env var
power_automate_url: ${MSTEAMS_POWER_AUTOMATE_URL} # Power Automate HTTP trigger URL
template_path: "config/msteams_message.tmpl"
other_power_urls: # Optional: Enable overriding the default Power Automate flow
qc: ${MSTEAMS_OTHER_POWER_URL_QC}
ops: ${MSTEAMS_OTHER_POWER_URL_OPS}
dev: ${MSTEAMS_OTHER_POWER_URL_DEV}
2. Update Your Environment Variables
If you're using environment variables, update them:
# Old (v1.1.5)
MSTEAMS_WEBHOOK_URL=https://...
MSTEAMS_OTHER_WEBHOOK_URL_QC=https://...
# New (v1.2.0)
MSTEAMS_POWER_AUTOMATE_URL=https://...
MSTEAMS_OTHER_POWER_URL_QC=https://...
3. Setting up Power Automate for Microsoft Teams
To set up Microsoft Teams integration with Power Automate:
-
Create a new Power Automate flow:
- Sign in to Power Automate
- Click on "Create" → "Instant cloud flow"
- Select "When a HTTP request is received" as the trigger
-
Configure the HTTP trigger:
- The HTTP POST URL will be generated automatically after you save the flow
- For the Request Body JSON Schema, you can use:
{ "type": "object", "properties": { "message": { "type": "string" } } } -
Add a "Post message in a chat or channel" action:
- Click "+ New step"
- Search for "Teams" and select "Post message in a chat or channel"
- Configure the Teams channel where you want to post messages
- In the Message field, use:
@{triggerBody()?['message']} -
Save your flow and copy the HTTP POST URL:
- After saving, go back to the HTTP trigger step to see the generated URL
- Copy this URL and use it for your
MSTEAMS_POWER_AUTOMATE_URLenvironment variable or directly in your configuration file
4. Update Your API Calls
If you're making direct API calls that use the Teams integration, update your query parameters:
Old (v1.1.5):
POST /api/incidents?msteams_other_webhook_url=qc
New (v1.2.0):
POST /api/incidents?msteams_other_power_url=qc
5. Update Your Microsoft Teams Templates (Optional)
The template syntax remains the same, but you might want to review your templates to ensure they work correctly with the new integration. Here's a sample template for reference:
# Critical Error in {{.ServiceName}}
**Error Details:**
```{{.Logs}}```
Please investigate immediately
Testing the Migration
After updating your configuration, test the Microsoft Teams integration to ensure it's working correctly:
curl -X POST http://your-versus-incident-server:3000/api/incidents \
-H "Content-Type: application/json" \
-d '{"service_name": "Test Service", "logs": "This is a test incident alert for Microsoft Teams integration"}'
Additional Notes
- The older Microsoft Teams integration using webhook URLs still work after upgrading to v1.2.0, just update properties
webhook_url→power_automate_url - If you experience any issues with message delivery to Microsoft Teams, check your Power Automate flow run history to debug potential issues
- For organizations with multiple teams or departments, consider setting up separate Power Automate flows for each team and configuring them with the
other_power_urlsproperty
Migration Guide to v1.3.0
Table of Contents
- Key Changes in v1.3.0
- How to Migrate from v1.2.0
- Complete Configuration Example
- Upgrading from v1.2.0
This guide explains the changes introduced in Versus Incident v1.3.0 and how to update your configuration to take advantage of the new features.
Key Changes in v1.3.0
Version 1.3.0 introduces enhanced on-call management capabilities and configuration options, with a focus on flexibility and team-specific routing.
1. New Provider Configuration (Major Change from v1.2.0)
A significant change in v1.3.0 is the introduction of the provider property in the on-call configuration, which allows you to explicitly specify which on-call service to use:
oncall:
enable: false
wait_minutes: 3
provider: aws_incident_manager # NEW in v1.3.0: Explicitly select "aws_incident_manager" or "pagerduty"
This change enables Versus Incident to support multiple on-call providers simultaneously. In v1.2.0, there was no provider selection mechanism, as AWS Incident Manager was the only supported provider.
2. PagerDuty Integration (New in v1.3.0)
Version 1.3.0 introduces PagerDuty as a new on-call provider with comprehensive configuration options:
oncall:
provider: pagerduty # Select PagerDuty as your provider
pagerduty: # New configuration section in v1.3.0
routing_key: ${PAGERDUTY_ROUTING_KEY} # Integration/Routing key for Events API v2
other_routing_keys: # Optional team-specific routing keys
infra: ${PAGERDUTY_OTHER_ROUTING_KEY_INFRA}
app: ${PAGERDUTY_OTHER_ROUTING_KEY_APP}
db: ${PAGERDUTY_OTHER_ROUTING_KEY_DB}
The PagerDuty integration supports:
- Default routing key for general alerts
- Team-specific routing keys via the
other_routing_keysconfiguration - Dynamic routing using the
pagerduty_other_routing_keyquery parameter
Example API call to target the infrastructure team:
curl -X POST "http://your-versus-host:3000/api/incidents?pagerduty_other_routing_key=infra" \
-H "Content-Type: application/json" \
-d '{
"Logs": "[ERROR] Load balancer failure.",
"ServiceName": "lb-service",
"UserID": "U12345"
}'
3. AWS Incident Manager Environment-Specific Response Plans (New in v1.3.0)
Version 1.3.0 enhances AWS Incident Manager integration with support for environment-specific response plans:
oncall:
provider: aws_incident_manager
aws_incident_manager:
response_plan_arn: ${AWS_INCIDENT_MANAGER_RESPONSE_PLAN_ARN} # Default response plan
other_response_plan_arns: # New in v1.3.0
prod: ${AWS_INCIDENT_MANAGER_OTHER_RESPONSE_PLAN_ARN_PROD}
dev: ${AWS_INCIDENT_MANAGER_OTHER_RESPONSE_PLAN_ARN_DEV}
staging: ${AWS_INCIDENT_MANAGER_OTHER_RESPONSE_PLAN_ARN_STAGING}
This feature allows you to:
- Configure multiple response plans for different environments
- Dynamically select the appropriate response plan using the
awsim_other_response_planquery parameter - Use a more flexible named environment approach for response plan selection
Example API call to use the production environment's response plan:
curl -X POST "http://your-versus-host:3000/api/incidents?awsim_other_response_plan=prod" \
-H "Content-Type: application/json" \
-d '{
"Logs": "[ERROR] Production database failure.",
"ServiceName": "prod-db-service",
"UserID": "U12345"
}'
How to Migrate from v1.2.0
If you're upgrading from v1.2.0, update your on-call configuration to include the provider property.
Complete Configuration Example
Replace your existing on-call configuration with the new structure:
oncall:
enable: false # Set to true to enable on-call functionality
wait_minutes: 3 # Time to wait for acknowledgment before escalating
provider: aws_incident_manager # or "pagerduty"
aws_incident_manager: # Used when provider is "aws_incident_manager"
response_plan_arn: ${AWS_INCIDENT_MANAGER_RESPONSE_PLAN_ARN}
other_response_plan_arns: # NEW in v1.3.0: Optional environment-specific response plan ARNs
prod: ${AWS_INCIDENT_MANAGER_OTHER_RESPONSE_PLAN_ARN_PROD}
dev: ${AWS_INCIDENT_MANAGER_OTHER_RESPONSE_PLAN_ARN_DEV}
staging: ${AWS_INCIDENT_MANAGER_OTHER_RESPONSE_PLAN_ARN_STAGING}
pagerduty: # Used when provider is "pagerduty"
routing_key: ${PAGERDUTY_ROUTING_KEY}
other_routing_keys: # Optional team-specific routing keys
infra: ${PAGERDUTY_OTHER_ROUTING_KEY_INFRA}
app: ${PAGERDUTY_OTHER_ROUTING_KEY_APP}
db: ${PAGERDUTY_OTHER_ROUTING_KEY_DB}
redis: # Required for on-call functionality
host: ${REDIS_HOST}
port: ${REDIS_PORT}
password: ${REDIS_PASSWORD}
db: 0
Upgrading from v1.2.0
-
Update your Versus Incident deployment to v1.3.0:
# Docker docker pull ghcr.io/versuscontrol/versus-incident:v1.3.0 # Or update your Kubernetes deployment to use the new image -
Update your configuration as described above, ensuring that Redis is properly configured if you're using on-call features.
-
Restart your Versus Incident service to apply the changes.
For any issues with the migration, please open an issue on GitHub.
Migration Guide to v1.4.0
Table of Contents
This guide explains the changes introduced in Versus Incident v1.4.0
and how to update your configuration. Most existing deployments need
no config changes — the AI agent stays opt-in and defaults to
agent.enable: false.
Key Changes in v1.4.0
1. AI Detect Mode is now end-to-end
In v1.3.x, the agent could observe and shadow-log unknown patterns but
could not emit incidents from AI verdicts. In v1.4.0, switching
agent.mode: detect now:
- Forwards unknown / spike patterns to the configured LLM
(
agent.ai.enable: true). - Caches and rate-limits the AI calls.
- Emits the resulting finding as a normal incident through
services.CreateIncident— meaning all your existing channels (Slack, Telegram, MS Teams, Lark, Viber, Email) and the on-call workflow trigger unchanged. No new fan-out logic.
Every AI call is also persisted to a bounded audit log
(<storage.data_dir>/detect.json, capped at 500 events) and viewable
in the UI under Agent → Detect.
See the new guide: AI Detect Mode.
2. Removed: agent.ai.base_url
The OpenAI endpoint is now hardcoded to
https://api.openai.com/v1/chat/completions. The base_url field and
AGENT_AI_BASE_URL env var are no longer recognised.
Action: if your config.yaml contains agent.ai.base_url, remove
the line. The server logs an unused-key warning at startup but does not
fail. A future minor release may treat unknown keys as fatal.
agent:
ai:
enable: true
- base_url: https://api.openai.com/v1
api_key: ${OPENAI_API_KEY}
model: gpt-4o-mini
Multi-LLM support (Anthropic, Bedrock, Ollama, OpenAI-compatible gateways) is on the roadmap under Phase 7.
3. New admin endpoints (gated by gateway_secret)
| Method | Path | Purpose |
|---|---|---|
| GET | /api/agent/detect | List detect-mode AI calls |
| GET | /api/agent/detect/stats | Aggregate counts |
| GET | /api/agent/detect/:id | Single call: prompts + raw response + finding |
| DELETE | /api/agent/detect | Clear detect log |
| POST | /api/agent/detect/flush | Force-persist detect log |
| GET | /api/agent/ai/system-prompt | Read assembled system prompt |
All require the X-Gateway-Secret header to match the root-level
gateway_secret. An empty secret means the admin endpoints are not
registered at all — no silent open admin surface.
4. Notification templates updated
If you use the shipped templates (config/{slack,telegram,msteams, lark,viber}_message.tmpl), no action is required — they now correctly
render AI-emitted incidents with verdict, category, frequency,
confidence, suggestions, and sample log.
If you have forked any of these templates, port the new
Versus Agent source detection block. Look for the if eq .Source "Versus Agent" branch in the upstream files.
5. core.AISRE.Analyze signature change (Go integrators only)
This only matters if you have a custom implementation of the
core.AISRE interface in your fork.
type AISRE interface {
- Analyze(ctx context.Context, r AgentResult) (*AIFinding, error)
+ Analyze(ctx context.Context, r AgentResult) (*AICallResult, error)
}
AICallResult wraps the finding plus the prompt sent, the raw response
received, the model name, and the call duration. The detect-mode audit
log uses these fields. Update your implementation to populate them
(empty strings are tolerated for non-OpenAI backends).
How to Migrate from v1.3.x
Most users do not need to change anything. The agent is opt-in and disabled by default.
If you were already running the agent in training or shadow mode:
-
Keep your existing
agent.*config anddata/patterns.json. -
Remove
agent.ai.base_urlif present (see §2). -
To enable detect mode, set
agent.mode: detectand provide an OpenAI API key:agent: enable: true mode: detect ai: enable: true api_key: ${OPENAI_API_KEY} model: gpt-4o-mini max_calls_per_hour: 30 cache_ttl: 1h gateway_secret: ${GATEWAY_SECRET} -
Verify the audit trail at
GET /api/agent/detect(withX-Gateway-Secretheader) or in the UI under Agent → Detect.
If you fork the channel templates, see §4.
Upgrading
# Docker
docker pull ghcr.io/versuscontrol/versus-incident:v1.4.0-beta
# Helm
helm repo update
helm upgrade versus-incident oci://ghcr.io/versuscontrol/charts/versus-incident \
--version 1.4.0
Restart the service to apply the changes. Existing pattern catalogs and shadow logs are forward-compatible (no schema migration).
Helm chart changes (1.3.x → 1.4.0)
Chart 1.4.0 adds first-class support for everything that v1.4.0
ships in the binary. Key additions to values.yaml:
# NEW — required for the dashboard and every /api/admin/* and
# /api/agent/* endpoint. Empty value leaves admin routes unregistered.
gatewaySecret: ""
# NEW — pluggable storage backend (only `file` is implemented today).
# Persist the data dir so incident history and the agent catalog
# survive pod restarts.
storage:
type: file
file:
dataDir: /app/data
maxIncidents: 1000
persistence:
enabled: false
size: 1Gi
accessMode: ReadWriteOnce
# existingClaim: my-pvc
# NEW — opt-in AI SRE Agent (training | shadow | detect).
agent:
enable: false
mode: training
pollInterval: 30s
newServiceGrace: 30m
ai:
enable: false
apiKey: "" # stored in the chart Secret
model: "gpt-4o-mini"
maxCallsPerHour: 60
cacheTtl: "1h"
sources: [] # see helm.md for examples
The chart also adds pre-flight validation that fails the render in three previously-silent misconfigurations:
- Unknown
storage.type. storage.persistence.enabled=truewithaccessMode: ReadWriteOnceandreplicaCount > 1(the PVC cannot be mounted on multiple pods).agent.enable=truewithreplicaCount > 1(the agent worker is single-writer to the catalog and detect log).
If you previously ran multiple replicas with the agent or persistence
hand-rolled, drop replicas to 1 and disable autoscaling before
upgrading:
replicaCount: 1
autoscaling:
enabled: false
If you set gatewaySecret to an empty value, the dashboard and admin
endpoints are not registered. Generate a strong value at install:
helm upgrade --install versus-incident \
oci://ghcr.io/versuscontrol/charts/versus-incident \
--version 1.4.0 \
-f values.yaml \
--set gatewaySecret="$(openssl rand -hex 32)" \
--set agent.ai.apiKey="$OPENAI_API_KEY"
For the full chart guide including agent setup, see
src/userguide/helm.md.
For any issues with the migration, please open an issue.