AI Agent — Shadow Mode
Shadow mode is the practice run between training and detect. The agent keeps learning, and on top of that it decides what it would have alerted on — and writes those decisions to a file you can read later. It does not send any alerts.
Think of it as: "show me what you would have woken me up for, so I can decide if I trust you."
When to switch to shadow
Stay in training until new patterns stop showing up often —
usually a few days for a small service, longer for a large setup.
Then switch the mode:
docker stop versus-agent
docker run -d \
  --name versus-agent \
  ... \
  -e AGENT_MODE=shadow \
  ghcr.io/versuscontrol/versus-incident:latest
Or change agent.mode in config.yaml and restart.
The catalog and the shadow log live next to each other under
data_dir:
data/
├── patterns.json     # learned templates (kept growing in shadow)
└── shadow.json       # would-have-alerted entries (only written in shadow)
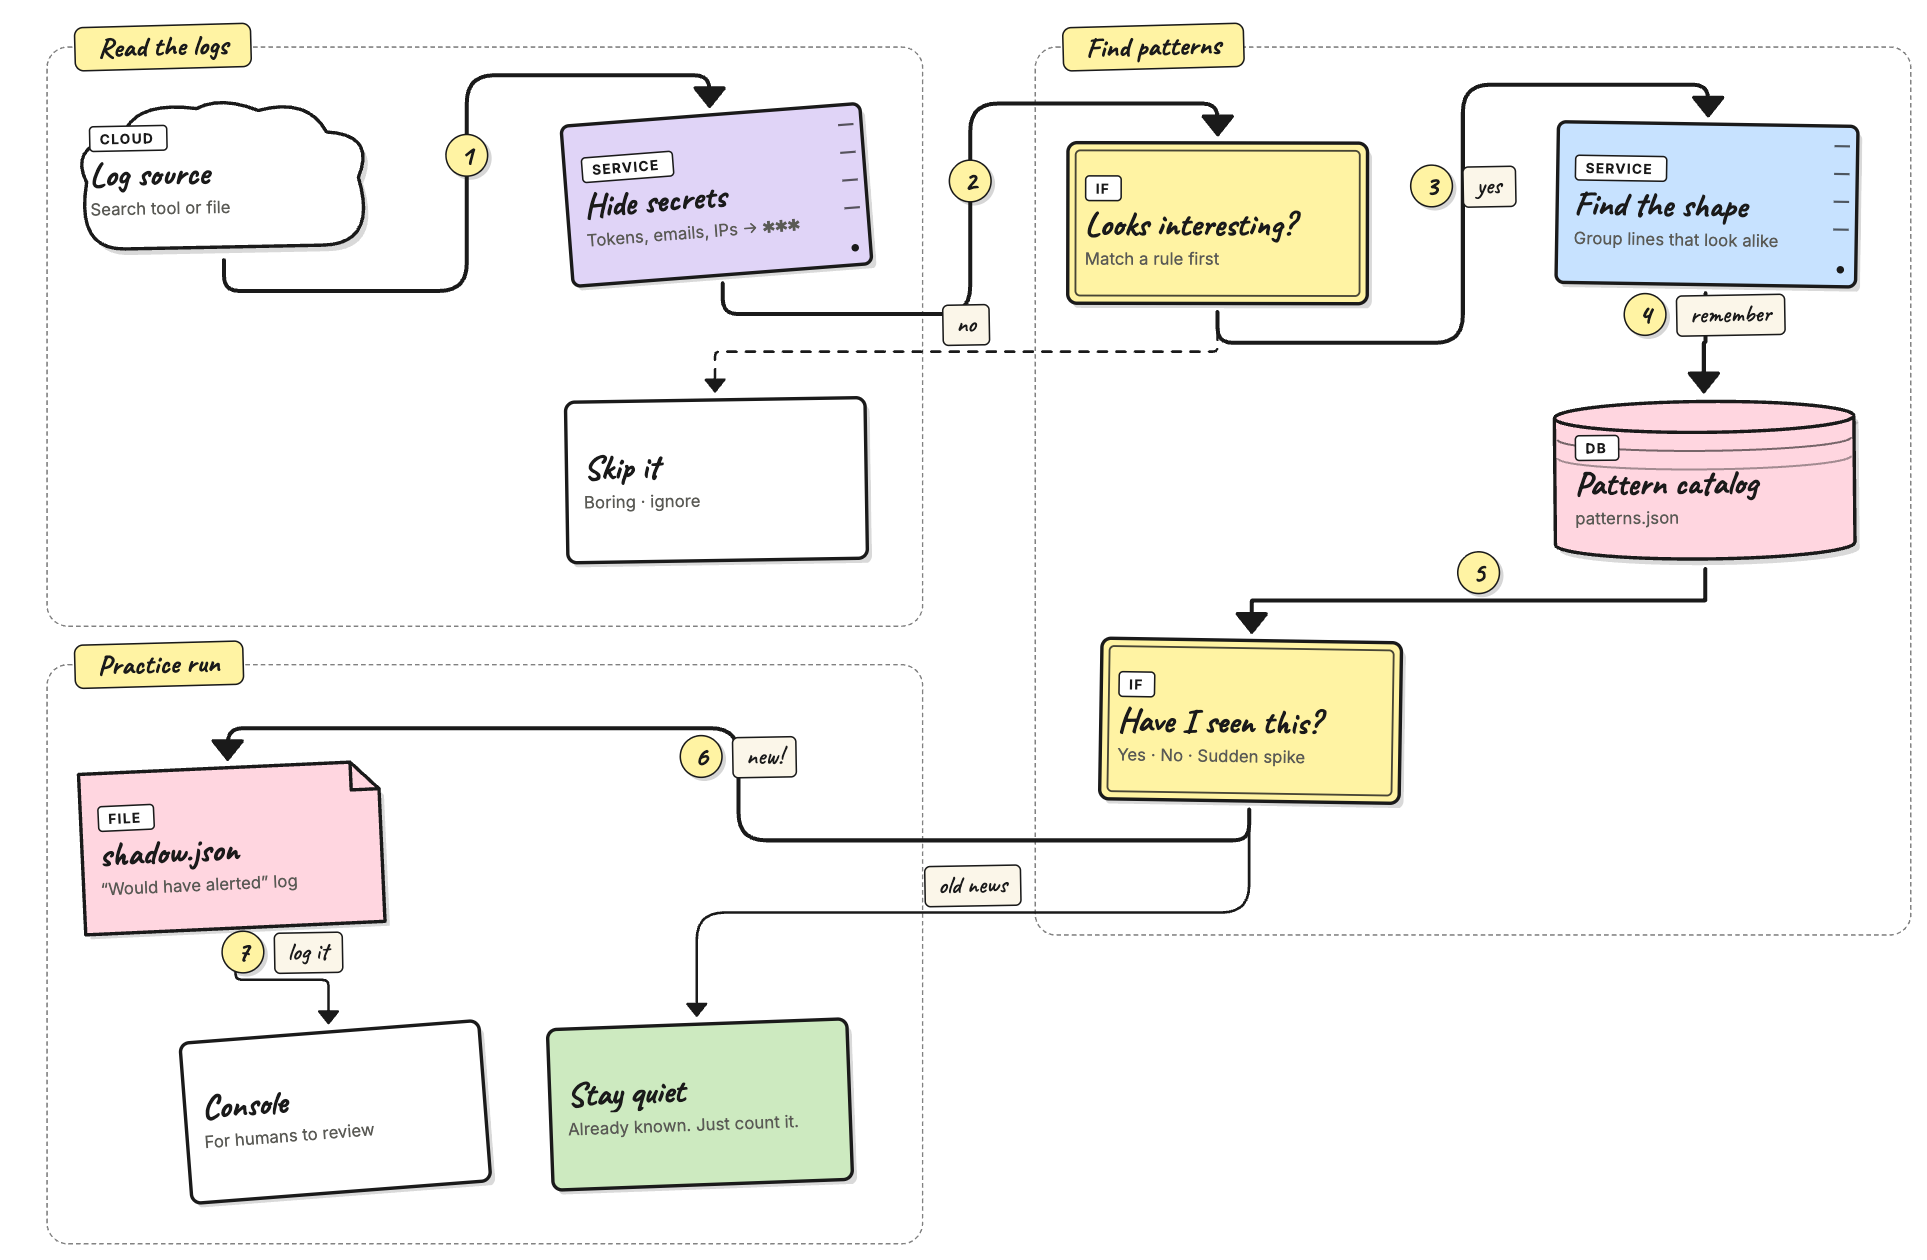
How shadow mode works
Shadow mode runs the same steps as training (read → hide secrets →
filter → group → save) and adds one extra step at the end:
look at the result and, if it isn't already known, write a row to
shadow.json.
Three things to remember:
- The catalog still grows. Every line that passes the secret hider and the filter rules is added to the catalog, just like in training. Switching to shadow doesn't pause learning.
- The new step is just a check. A pattern is "known" when
either (a) you labeled it
knownthrough the admin API, or (b) it has been seen at leastauto_promote_aftertimes. Anything else is "unknown" and ends up in the shadow log. - No real alerts. Would-have-alerted entries land in
shadow.json(saved on disk, read through the API) and also print a green line in stdout.
What gets recorded
Every time the agent checks for new logs, each line that survives the earlier steps falls into one of three buckets:
- Known — quietly update the catalog and move on. This is what most lines do once the agent has trained.
- Unknown — write a row to the shadow log. This happens for a
brand-new template, or for a rare template that hasn't been
seen
auto_promote_aftertimes yet. - Spike — reserved for a future release. The label exists in
the file format today but nothing produces it; you'll see
verdict_spike: 0in the stats.
A pattern is "known" when either of these is true:
- You've labeled it as known through
POST /api/agent/patterns/<id>with body{"verdict":"known"}. This takes effect right away and stays until you change it. - It has been seen at least
agent.catalog.auto_promote_aftertimes (default100). The agent saves this auto-promotion topatterns.jsonso you can check which patterns it considers baseline.
One row per pattern, not per line
If the agent wrote one row for every flagged line, a busy cluster
would drown the shadow log. Instead, the log keeps one row per
(source, pattern_id) pair. When the same pattern is hit again,
that row is updated:
count+= new lines seen this tick (the raw count).occurrences+= 1 (one tick = one occurrence, no matter how many lines fired).templateis refreshed if the grouper improved it.last_seenis set to now (UTC).rule_nameis upgraded if a more specific filter rule now matches.
So if 200 NTP-skew lines arrive across 4 ticks, you don't get 200
rows — you get one row with count: 200, occurrences: 4.
Every recorded field
| Field | Meaning | Example |
|---|---|---|
pattern_id | Stable ID. Same as in the catalog, so you can look it up there. | p-9c2f01 |
template | Latest template. <*> marks the parts that change. | kernel: Out of memory: Killed process <*> (<*>) score 999 … |
source | The source name from agent_sources.yaml. Lets you tell prod from staging at a glance. | my-app |
rule_name | Filter rule that matched. default means the catch-all matched but no named rule did. Empty when filtering is off. | oom-killer / default |
verdict | unknown today; spike reserved for a future release. | unknown |
sample_message | One example line, with secrets already hidden, cut off at 512 bytes. | kernel: Out of memory: Killed process 1842 (versus-worker) score 999 … |
count | Total raw lines across every tick this row covers. | 17 |
occurrences | How many distinct ticks fired. Always ≤ count. | 3 |
first_seen | UTC time the row was first added. | 2026-04-30T18:21:04Z |
last_seen | UTC time of the most recent hit. Used for sorting and for cleanup. | 2026-04-30T18:31:42Z |
Size limit and cleanup
The shadow log holds at most 1000 different (source, pattern_id)
pairs (currently fixed). When it's full, the row with the oldest
last_seen is dropped to make room. You shouldn't hit this on a
normal-sized service: 1000 different anomalies in a single review
window means something is very wrong (or the filter rules are
too loose — see Filter rules).
shadow.json is written safely (write to a temp file, then rename),
so you can cat it from disk while the agent is running without
risking a half-written read.
Stdout mirror
You'll also see a green line in the agent's logs every time a row is recorded:
agent[shadow]: would alert pattern=p-abc123 tag=default verdict=unknown freq=4
freq is the per-tick count — the same number that gets added
to count in the JSON. Use stdout for live debugging while you're
tuning filter rules; use the API for review.
Try it locally with the noisy-logs script
If you went through Getting Started, you
already have the agent running against ./logs/my-app.log with
from_beginning: true. The repo has a
scripts/generate_noisy_logs.py script that mixes about 30
common templates with a few rare, production-style oddities (kernel
OOM with score, segfaults, expired TLS certs, NTP clock skew, lost
Raft quorum, replication lag, unexpected SIGTERM, …). Those rare
lines are exactly what shadow mode is meant to catch.
Step 1 — train on the boring baseline. With the agent in
training, point the live script at the log file and let it run
for a few minutes:
./scripts/run_noisy_logs.sh \
  --output ./logs/my-app.log \
  --interval 1 --batch 50
Watch the agent logs: the agent: new pattern lines should slow
down within a minute or two. That's your baseline.
Step 2 — switch to shadow mode. Stop the container, start it
again with AGENT_MODE=shadow. The catalog you just built is
saved to disk (data/patterns.json), so the agent already knows
what "normal" looks like.
Step 3 — keep generating logs. Restart the live script (or just leave it running). Most of what comes through is now the boring baseline, which the agent treats as known. The rare lines end up in the shadow log:
agent[shadow]: would alert pattern=p-9c2f01 tag=default verdict=unknown freq=1
agent[shadow]: would alert pattern=p-7e1a44 tag=default verdict=unknown freq=2
Step 4 — review. After a minute or two, hit the admin endpoint:
curl -H "X-Gateway-Secret: $SECRET" \
  http://localhost:3000/api/agent/shadow | jq '.events[] | {template, count, occurrences}'
You'll see entries like:
{ "template": "service=notifier message=\"x509 certificate expired\" host=<*> expired_at=<*> chain_position=<*>", "count": 1, "occurrences": 1 }
This is the "what you would have been alerted about" version. Use the loop in A typical review loop below to triage them.
Tip. Want a forced demo? Append a single batch of mostly baseline + anomalies to the file the agent is reading while in shadow mode:
python3 scripts/generate_noisy_logs.py \
  --append --start-time now \
  --output ./logs/my-app.log --lines 500
500 lines at default weights gives about 25 anomaly lines across ~10 different templates — a tidy worked example.
Reading the shadow log
The /api/agent/shadow* endpoints are how you actually use the
log. They're admin-only — every request needs the
X-Gateway-Secret header (set with AGENT_GATEWAY_SECRET). The
examples below assume you saved that value into a shell variable:
export SECRET=change-me # whatever you set as AGENT_GATEWAY_SECRET
All responses are JSON; piping to jq (or python -m json.tool)
makes them easier to read.
List every entry (most recent first)
Start here. The endpoint returns every distinct (source, pattern_id) the agent flagged in the current window, sorted by
last_seen so the freshest noise is on top:
curl -H "X-Gateway-Secret: $SECRET" \
  http://localhost:3000/api/agent/shadow | jq
Sample output:
{
  "events": [
    {
      "pattern_id": "p-abc123",
      "template": "GET /api/users/<*> 500",
      "source": "my-app",
      "rule_name": "default",
      "verdict": "unknown",
      "sample_message": "GET /api/users/42 500",
      "count": 17,
      "occurrences": 3,
      "first_seen": "2026-04-30T18:21:04Z",
      "last_seen": "2026-04-30T18:31:42Z"
    }
  ]
}
The two numbers to watch:
count— how many raw lines matched. Highcount+ lowoccurrencesmeans a brief flurry; high in both means a steady drip you should look at.occurrences— how many distinct ticks the pattern fired in. Each tick is one polling cycle (agent.poll_interval).
If you only want to see something specific, pipe through jq:
# templates and counts only
curl -s -H "X-Gateway-Secret: $SECRET" http://localhost:3000/api/agent/shadow \
  | jq '.events[] | {template, count, rule_name}'

# everything tagged "oom"
curl -s -H "X-Gateway-Secret: $SECRET" http://localhost:3000/api/agent/shadow \
  | jq '.events[] | select(.rule_name == "oom")'
Summary stats
Useful for dashboards or a quick "is this getting better?" check between review rounds:
curl -H "X-Gateway-Secret: $SECRET" \
  http://localhost:3000/api/agent/shadow/stats | jq
{
  "events": 12,
  "total_signals": 248,
  "total_occurrences": 41,
  "verdict_unknown": 12,
  "verdict_spike": 0
}
What each number means:
events— distinct(source, pattern_id)pairs in the log.total_signals— sum ofcountacross every entry. The raw volume.total_occurrences— sum ofoccurrences. Roughly: "how many ticks would have paged me?".verdict_unknown/verdict_spike— breakdown by label. Spike is reserved for a future release; today it's always 0.
A healthy review cycle drives events and total_occurrences
down over time, even as total_signals stays flat (because
you're labeling the boring patterns as known).
Force-save to disk
The worker only writes shadow.json every
catalog.persist_interval (default 30s) so it doesn't hammer the
disk. If you need a snapshot right now — to copy the file out
of a container, attach to a bug report, or just check what would
land on disk — ask the agent to save:
curl -X POST -H "X-Gateway-Secret: $SECRET" \
  http://localhost:3000/api/agent/shadow/flush
Does nothing if the log is already saved (shadow_dirty: false).
Clear the log
Once you've reviewed a batch and either labeled the patterns as known or fixed the underlying bug, drop the log so the next round starts from zero:
curl -X DELETE -H "X-Gateway-Secret: $SECRET" \
  http://localhost:3000/api/agent/shadow
This also saves the empty file so a restart doesn't bring the old entries back. The catalog is left alone — every learned pattern stays exactly where it was. You're only emptying the "would have alerted" inbox.
Status endpoint
A cheap health check that tells you both stores at a glance:
curl -H "X-Gateway-Secret: $SECRET" \
  http://localhost:3000/api/agent/status | jq
{
  "patterns": 87,
  "dirty": false,
  "shadow_events": 12,
  "shadow_dirty": true
}
patterns— number of entries in the catalog.dirty— catalog has changes that haven't been saved yet.shadow_events— distinct entries in the shadow log right now.shadow_dirty— same idea for the shadow log.
If shadow_events stops growing and shadow_dirty stays false
for many ticks, the agent has nothing new to flag — a good sign
you're getting close to ready for detect mode.
A typical review loop
This is the pattern you'll repeat for as long as the agent is in shadow mode. Each pass should make the next one quieter.
- Run shadow mode for about 24 hours. Long enough to cover at least one full traffic cycle (peak hours, off-peak, any nightly cron jobs).
- Pull the entries.
GET /api/agent/shadowand skim them. Sort them in your head into three groups: real anomalies you'd want to be paged about, noise that should have been silenced, and "new but legitimate" patterns (fresh deploys, new endpoints, etc.). - For things you would want to be paged about:
-
Add or improve a rule under
agent.regex.rulesinconfig.yamlso the pattern gets the rightnamenext time. -
Example: a
quorum lostline that landed withrule_name: defaultdeserves its own rule:agent: regex: rules: - name: quorum-lost pattern: "(?i)quorum lost"
-
- For things that are just noise:
-
Either raise
agent.catalog.auto_promote_after(default 100) so the pattern becomes "known" sooner, or label it as known by hand:curl -X POST -H "X-Gateway-Secret: $SECRET" \ -H "Content-Type: application/json" \ -d '{"verdict":"known","tags":["benign-validation-error"]}' \ http://localhost:3000/api/agent/patterns/p-abc123Once
verdict == "known", that pattern will never appear in the shadow log again, no matter how often it shows up.
-
- Clear the log:
DELETE /api/agent/shadow. The next round starts clean. - Repeat until the shadow log is mostly empty over a full release cycle (one or two weeks).
- Switch to detect. Set
AGENT_MODE=detectand you're live.
Common questions
Q: Will shadow mode send any alerts?
No. Not Slack, Telegram, email, on-call — nothing. It only writes
to shadow.json and stdout.
Q: Does shadow mode keep adding patterns to the catalog? Yes. Every line that passes the secret hider and filter rules is grouped and saved, exactly like in training. This is on purpose: shadow is "training plus a check" so you don't lose ground while reviewing.
Q: What happens if I switch back to training?
The shadow log is kept on disk and in memory; the worker just
stops adding to it. Switch back to shadow later and it picks up
where it left off.
Q: Can the shadow log fill up forever?
No. It holds at most 1000 distinct (source, pattern_id) pairs.
When full, the oldest-by-last_seen is dropped to make room. The
limit is currently fixed.
Q: Is shadow.json safe to delete by hand?
Yes — but only while the agent is stopped, and it'll come back on
the next tick anyway.
What's next
- Configuration — every setting and environment variable.
- Catalog — labeling patterns from the shadow log.
- Filter rules — tuning what reaches the grouper so shadow noise stays manageable.