AI Agent — Detect Mode
Detect mode is the go-live step. The agent classifies log patterns the same way it does in shadow, and when something genuinely new or anomalous shows up it asks an AI SRE to triage it and emits a real incident through the normal pipeline — so every channel you have configured (Slack, Telegram, Teams, Lark, Viber, Email, …) fires, and on-call escalation kicks in if enabled.
Think of it as: "shadow mode, but with a hand on the alert button — and the AI writes the page."
When to switch to detect
You're ready when all of these are true:
- The catalog has stopped growing fast (new patterns are rare).
- You've spent at least one release cycle in shadow and reviewed
the entries at
GET /api/agent/shadow. - You've labelled the obvious noisy patterns as
knownso they don't wake you up:POST /api/agent/patterns/<id>with{"verdict":"known"}. - You have an OpenAI-compatible API key.
Detect mode is opt-in twice:
agent.enable: trueANDagent.mode: detectANDagent.ai.enable: true. With the AI disabled, the worker still classifies signals but never calls a model — every detect outcome is recorded asdry.
How detect mode works
The pipeline is the same as shadow mode for the first few steps:
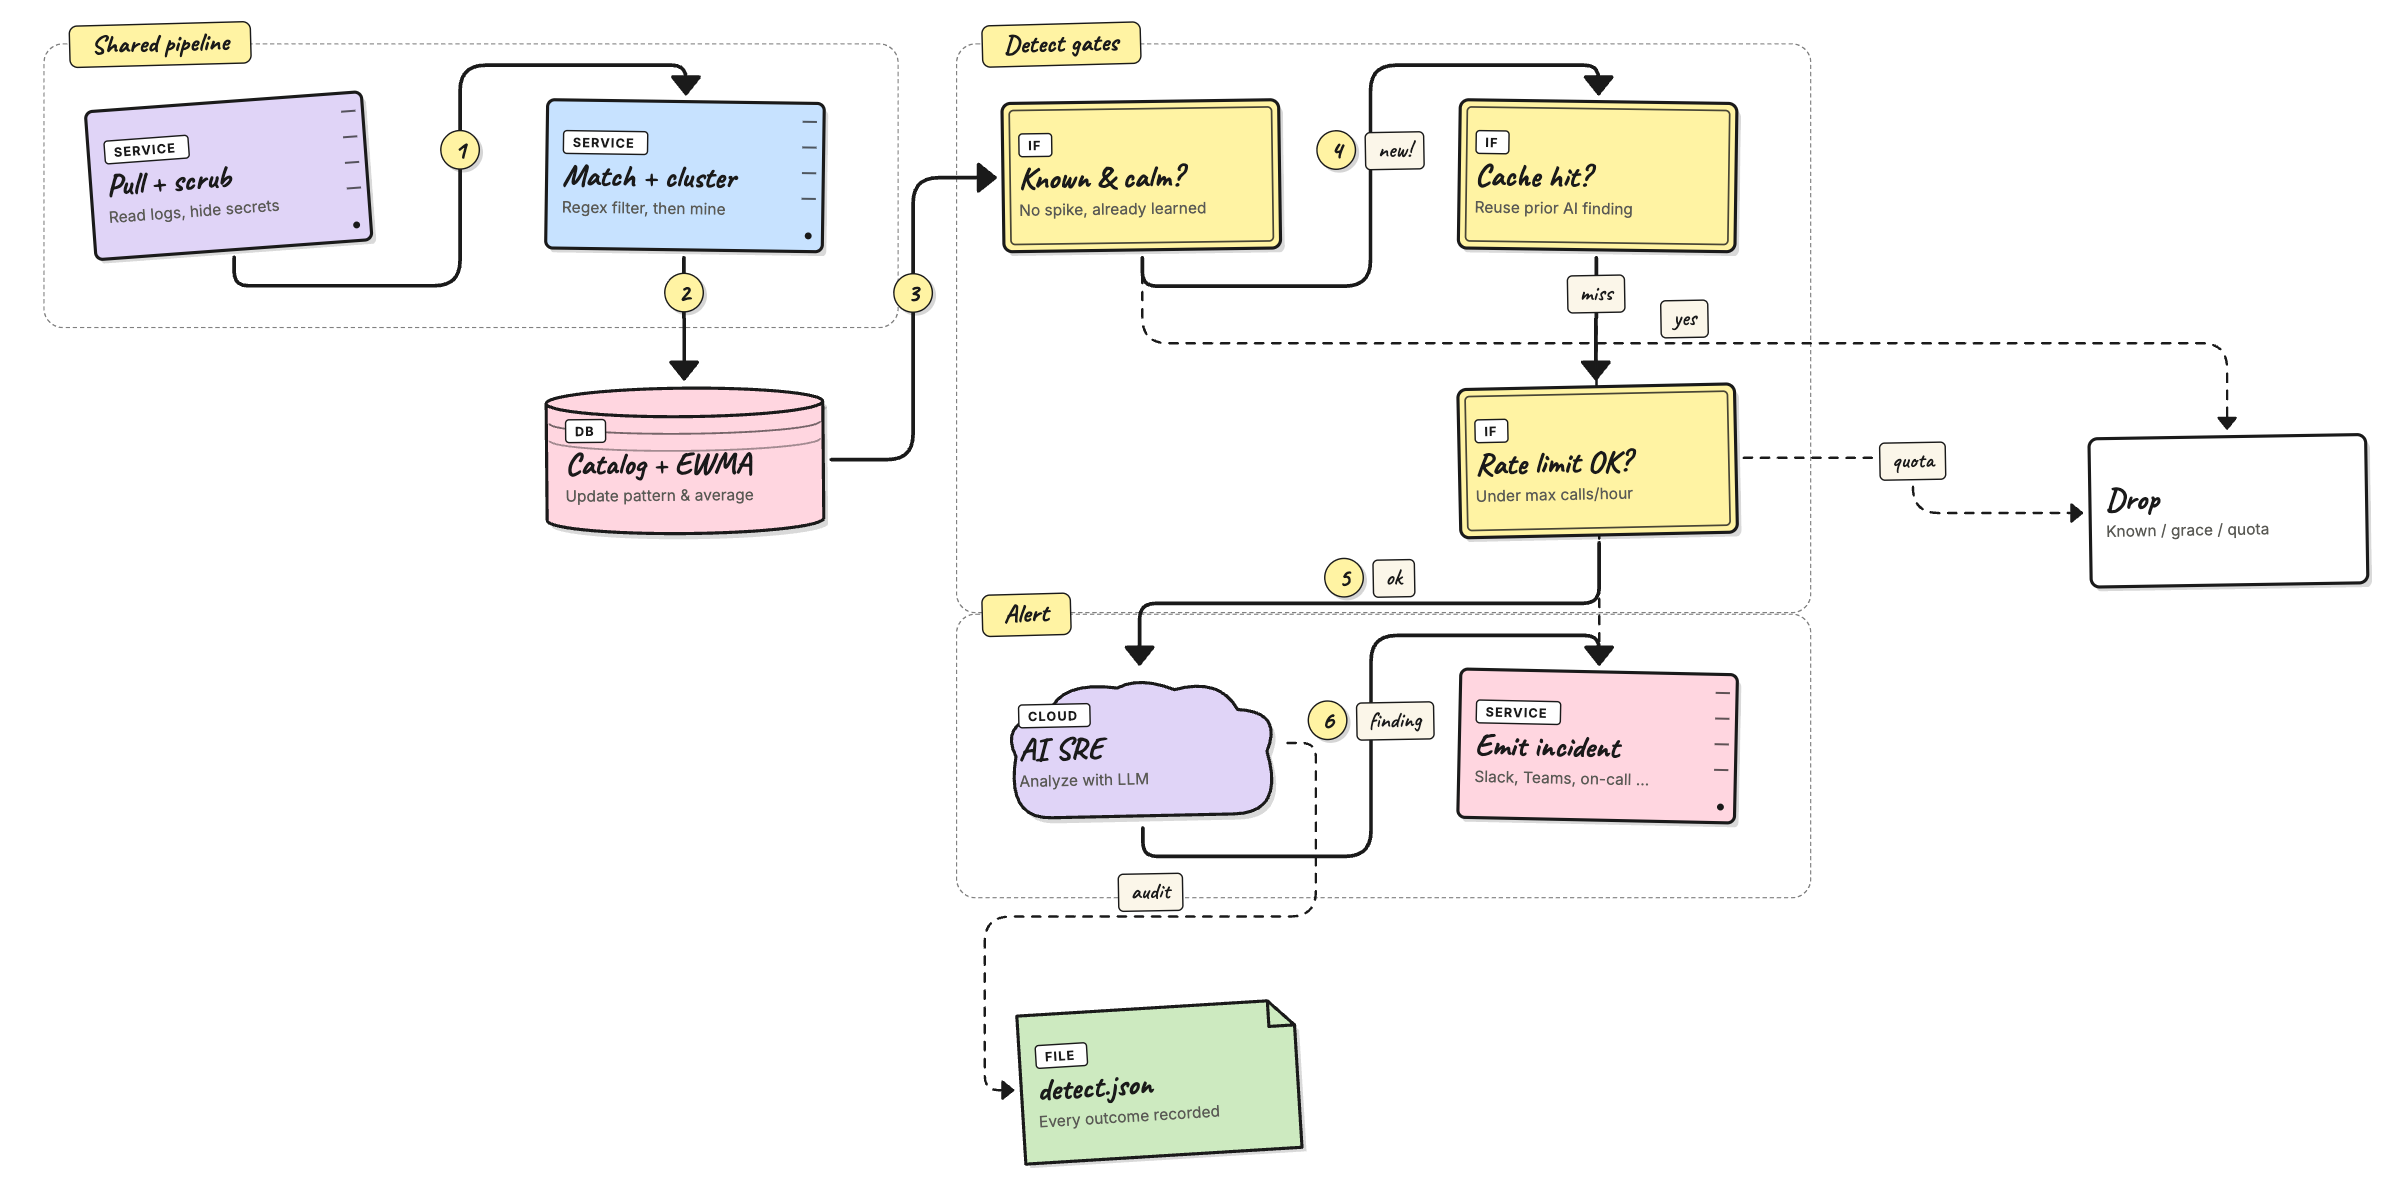
The detect tail does five things in order, all visible in the
per-tick log under the verdicts map:
- Dry guard — if the AI is not configured, log
emit_dryand stop. The worker still updated the catalog. - Cache lookup — keyed by
pattern_id. A hit reuses the previous AI finding without paying for another call. Counted asemit_cached. - Rate guard —
agent.ai.max_calls_per_hour. Stops a noisy day from running up an OpenAI bill. Counted asemit_quota. - Analyze — one
chat/completionscall against the model inagent.ai.model. The system prompt is assembled frompkg/agent/ai/prompts/*.md(SOUL,INPUTS,OUTPUT,RULES); the user prompt carries the redacted sample, template, frequency, baseline, and verdict. - Emit — the AI's
AIFinding(severity, summary, category, confidence, suggestions) is mapped into the standard incident content map and pushed. All per-channel templates and the on-call workflow trigger unchanged. Counted asemit_emitted.
Failures at step 4 or 5 land as emit_ai_error or
emit_send_error so you can spot misconfigured keys / channels
without grepping stack traces.
Configuration
The detect-specific block lives under agent.ai in
config.yaml:
agent:
  enable: true
  mode: detect

  ai:
    enable: true                       # opt in to live AI calls
    api_key: ${AGENT_AI_API_KEY}       # OpenAI-compatible bearer key
    model: gpt-4o-mini                 # any chat-completions model
    temperature: 0.2
    max_tokens: 800
    max_calls_per_hour: 60             # 0 = unlimited
    cache_ttl: 30m                     # reuse the same finding for this long
Every field is overridable by env var:
| Env var | Maps to |
|---|---|
AGENT_AI_ENABLE | agent.ai.enable |
AGENT_AI_API_KEY | agent.ai.api_key |
AGENT_AI_MODEL | agent.ai.model |
The chat endpoint is hard-coded to
https://api.openai.com/v1/chat/completions. If you point
AGENT_AI_API_KEY at an OpenAI-compatible provider (Azure
OpenAI, vLLM proxy, etc.), set model to a name your provider
accepts.
You almost always want a small new-service grace so the agent doesn't page on the first signal from a freshly-deployed service:
agent:
  new_service_grace: 30m       # silence brand-new services for this long
  service_patterns:            # how to extract a service from a log line
    - 'service[._]name=([\w.-]+)'
    - '"service"\s*:\s*"([^"]+)"'
    - '^\[([\w.-]+)\]'
See config/config.yaml
for the full set of starter patterns covering Pino, Winston,
Logback, Serilog, zap, slog, syslog, journald, Docker, Envoy,
nginx, and friends.
What gets recorded
Every AI call (and every cache / dry / quota outcome) is
appended to <storage.file.data_dir>/detect.json. The file is a
bounded ring of the most recent 500 events (FIFO); old
entries are evicted automatically.
Each event captures:
- Pattern context — source,
pattern_id, template, service, verdict, frequency, baseline, sample log line. - AI call — model, full user prompt, raw response,
duration. The system prompt is not stored per event — it's
constant per build; fetch it once via
GET /api/agent/ai/system-prompt. - Parsed finding — severity, summary, category, confidence, suggestions.
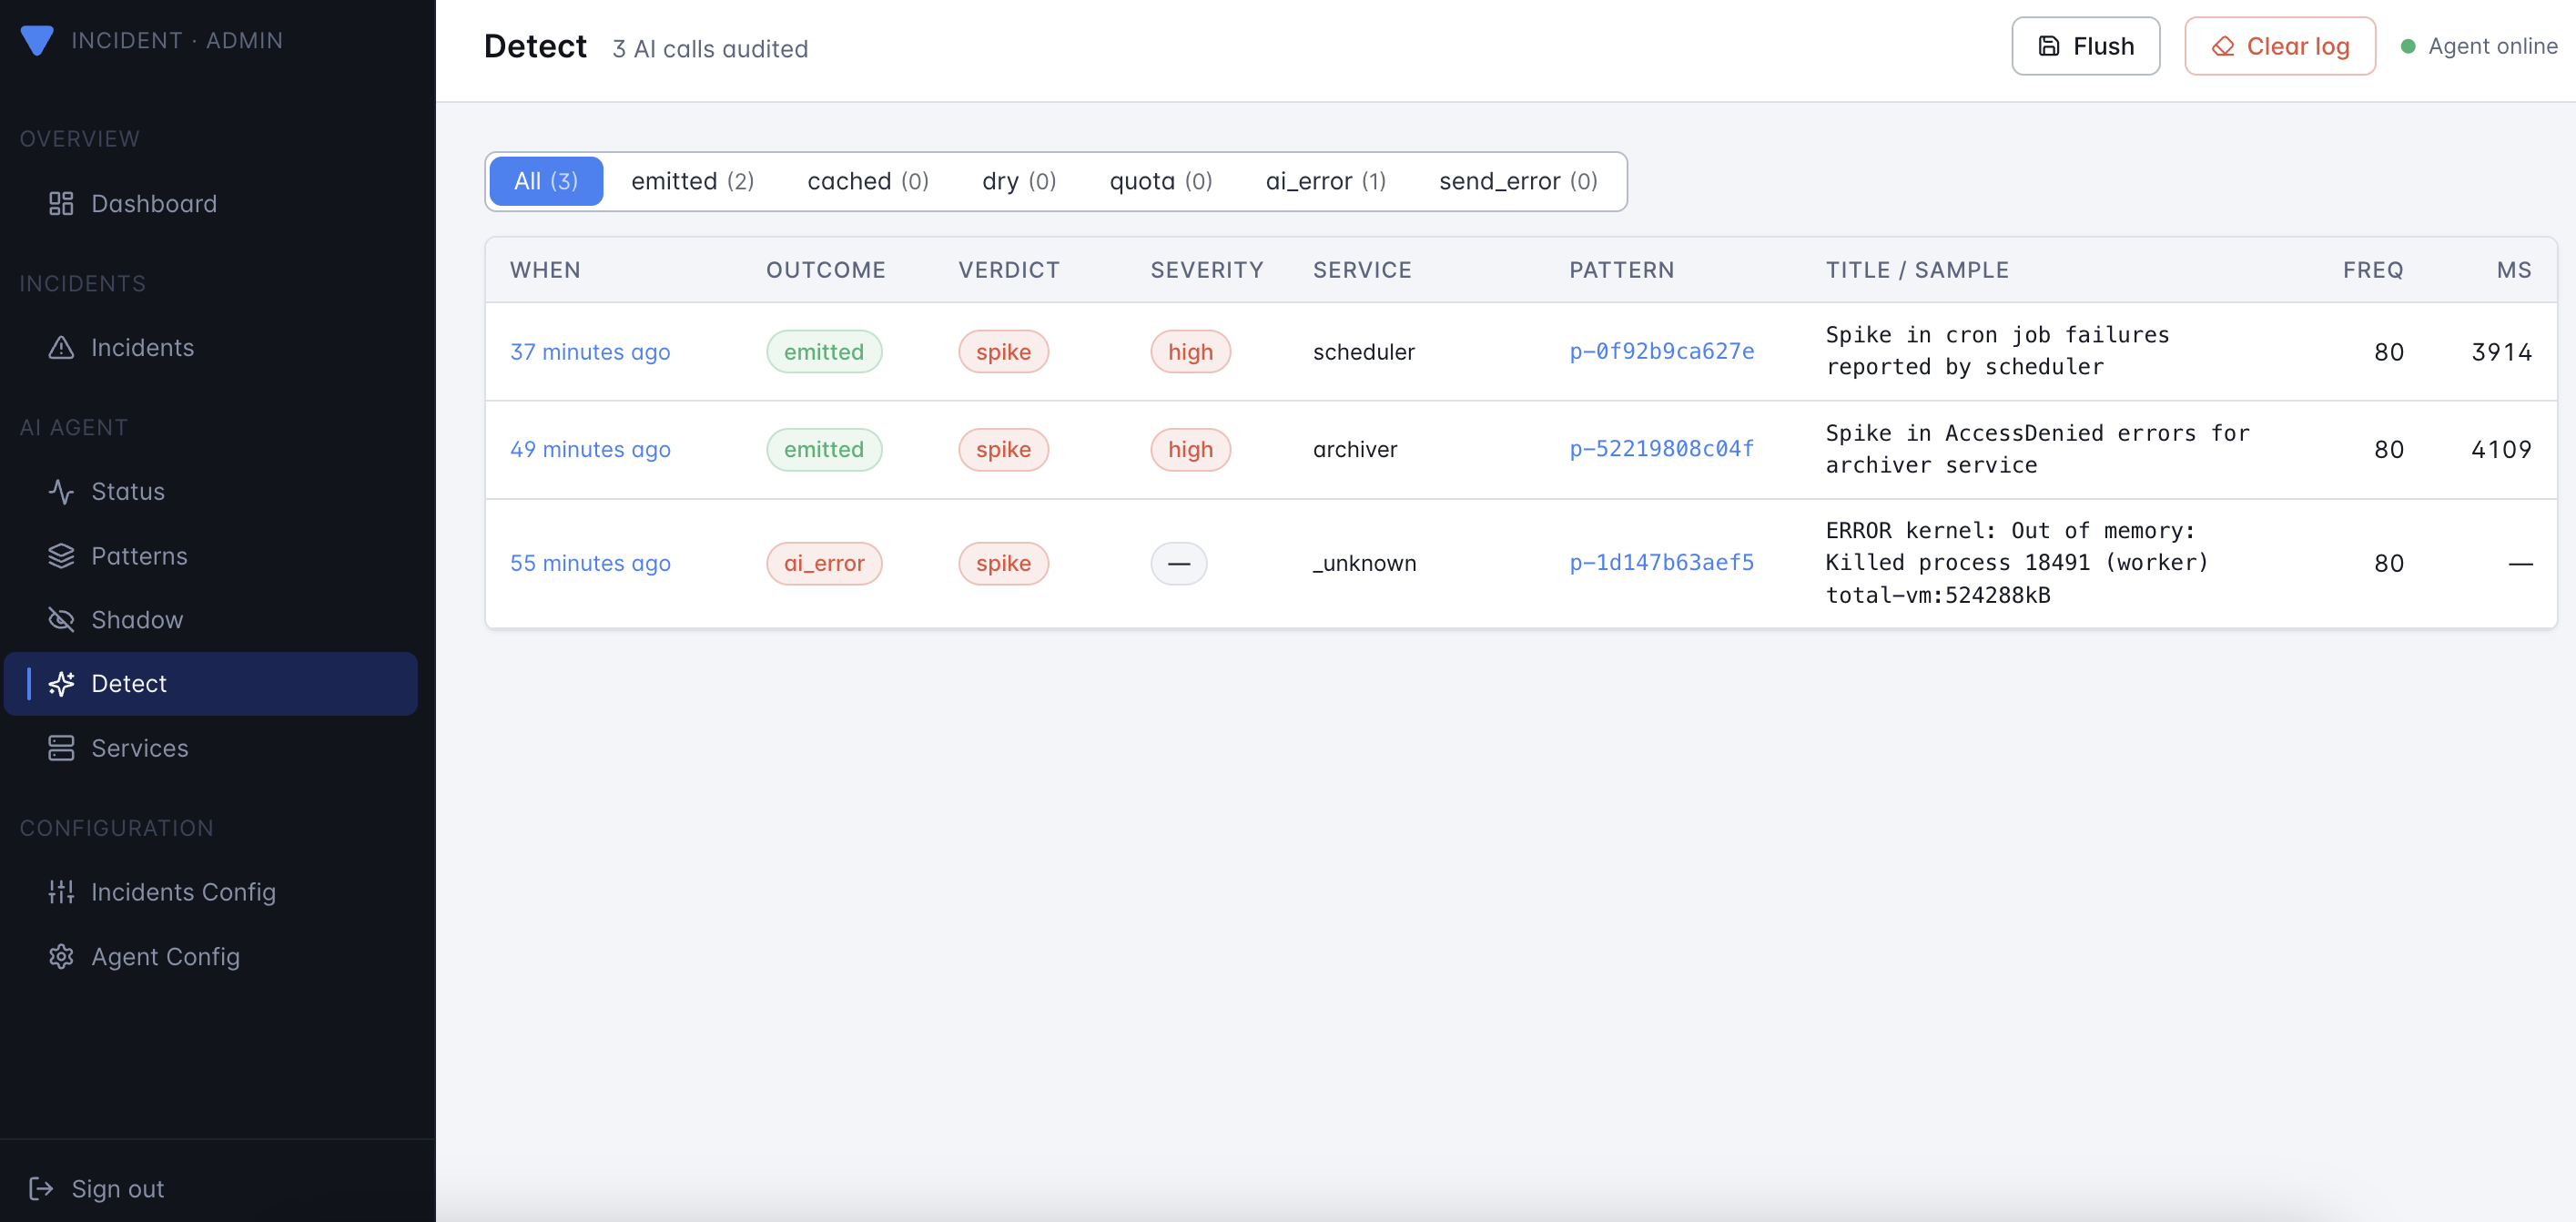
- Outcome — one of
emitted,cached,dry,quota,ai_error,send_error.
Look at it through the admin UI (the Detect page in the sidebar):
Worked example: end-to-end test
This walks through detect mode end to end on your laptop using the
generate_noisy_logs.py helper. The key trick is the new
--scenario flag, which emits a curated cluster of correlated
failures (e.g. db-outage = db_conn_refused +
db_query_slow + db_deadlock + replication_lag + …), not just
one repeated line. That gives the AI SRE enough context to write a
useful summary.
1. Train the catalog
Start with a clean catalog and a fat baseline of normal traffic so the agent learns what "boring" looks like.
# follow the steps in agent/getting-started.md to start the agent
# in training mode reading from ./logs/my-app.log

python3 scripts/generate_noisy_logs.py \
  --output ./logs/my-app.log \
  --lines 3000 --seed 42
Wait until the per-tick log stops adding new patterns — usually a minute or two for 3000 lines.
2. Switch to detect mode
Update config.yaml (or env vars) and restart the agent:
agent:
  enable: true
  mode: detect
  new_service_grace: 0          # disable grace for the demo
  ai:
    enable: true
    api_key: ${AGENT_AI_API_KEY}
    model: gpt-4o-mini
    max_calls_per_hour: 30
    cache_ttl: 30m
export AGENT_AI_API_KEY=sk-...
docker restart versus-agent
You should see in stdout:
agent: starting worker mode=detect sources=1 ai=enabled model=gpt-4o-mini
3. Inject a curated incident
Pick a scenario:
./scripts/run_noisy_logs.sh --list-scenarios
# auth-attack        auth-login-fail, syslog-sshd, security-breach
# cache-meltdown     redis-timeout, circuit-open, 5xx, worker-lag
# db-outage          db-conn-refused, db-query-slow, db-deadlock, …
# disk-full          disk-full, s3-upload-fail, cron-fail, panic
# k8s-imagepull      k8s-kubelet, pod-restart, k8s-event-json
# oom-cascade        kernel-oom-distinct, oom-killer, pod-restart, …
# tls-expired        certificate-expired, tls-handshake-fail, oncall-fail
Then inject one — say, a database outage — into the file the agent is reading:
./scripts/run_noisy_logs.sh \
  --output ./logs/my-app.log \
  --scenario db-outage \
  --scenario-burst 60
Within one poll interval (default 10s) you should see in the agent's stdout:
agent: tick my-app signals=60 matched=60 patterns=4 \
  verdicts=map[learned:0 spike:3 unknown:1 emit_emitted:2 emit_cached:1]
emit_emitted=2 means two AI calls produced a real incident
(other patterns hit the cache).
4. See what the AI wrote
Open the admin UI at http://localhost:3000 and click
Detect in the sidebar. You'll see the new events at the top.
Click into one to see:
- The full Prompt (system + user) sent to the model.
- The Raw response before JSON parsing.
- The parsed Finding (severity, summary, category, confidence, suggestions).
Or fetch it with curl:
curl -s -H "X-Gateway-Secret: $GATEWAY_SECRET" \
  http://localhost:3000/api/agent/detect | jq '.events[0]'
And the resulting incident lands in the Incidents page (and in Slack / Telegram / wherever you have channels enabled), with the AI's summary, severity, and suggested next steps rendered by each channel's template.
5. Try the other scenarios
Each scenario stresses a different part of the AI's reasoning:
./scripts/run_noisy_logs.sh --scenario tls-expired
./scripts/run_noisy_logs.sh --scenario disk-full
./scripts/run_noisy_logs.sh --scenario oom-cascade
Watch the category and severity fields in the parsed finding
move accordingly.
Cost & safety knobs
max_calls_per_hour— hard cap. With the cache TTL set to 30m and a sane catalog, even a noisy hour rarely calls the model more than ~5–10 times.cache_ttl— samepattern_idre-fires within this window reuses the prior finding for free. Bump it during incident storms; lower it if you want fresher analysis on long-running issues.new_service_grace— silences a brand-new service for the configured duration. The window starts the first time the agent sees the service, and is persisted inpatterns.jsonso it survives restarts.- Rotate the key if it ever appears in a log line you fed the
agent — the redactor scrubs common secret shapes
(
sk-…,xoxb-…, AWS keys, JWTs, basic-auth URLs) but treat it as defense-in-depth, not a guarantee.
Common questions
Q: Can I disable the AI but keep detect mode?
Yes. Set agent.ai.enable: false. The worker classifies
patterns and writes emit_dry outcomes to detect.json so you
can see what would have been analyzed, with no API spend.
Q: How do I stop a noisy pattern from being analyzed?
Mark it as known once and the worker drops it before reaching
the AI step:
curl -X POST -H "X-Gateway-Secret: $GATEWAY_SECRET" \
  -H "Content-Type: application/json" \
  -d '{"verdict":"known"}' \
  http://localhost:3000/api/agent/patterns/<pattern_id>
A spike on a known pattern still triggers (that's the whole
point of spike detection); use cache_ttl to throttle repeats.
Q: My channel template renders Unknown Alert (Unknown) for
AI incidents.
Update to the channel templates shipped with the latest release
— they auto-detect the AI payload via the PatternID field and
render a dedicated "Versus Agent" block.